|
 |
| |
| QC PLOTS |
| |
CURRENT |
HISORY |
| frame zeropoints |
 |
 |
| frame extinction coefficients |
|
|
| QC1 database
(fors2_zp_frame): browse | plot |
| instrumental zeropoint |
|
|
| night extinction
coefficients |
|
|
| QC1 database
(fors2_photometry): browse | plot |
Click on CURRENT to see the current trending (Health Check).
Click on HISTORY to see the historical evolution of the trending. |
Photometric zeropoints have been calculated from standard stars observations based on the Landolt catalogue (Landolt 1992, AJ 104, 340, used until 2008-03-31) and the Stetson catalogue (since 2008-04-01). You can find some information about conversion from the FORS2 filters here . There are two kinds of zeropoints - per frame and instrumental. The raw data have been:
- de-biassed,
- flat-fielded with a normalized twilight sky flat.
The twilight images of FORS2, which are used to create master sky flats, show evidence for a feature, whose position depends on the rotator angle (see overview). This limits the achievable photometric accuracy to about 5%. For more information see Moehler et al. (2010, PASP 122, 93).
| top Photometric
stability |
For the determination of a photometrically
stable night we evaluate the variation of the extinction
coefficient measured from standard stars frames. Since 2011 the FORS2 calibration
plan foresees, for potentially photometric nights the initial
acquisition of a low-high-airmass pair of standard fields, followed by further
standard fields around midnight and in the morning if SCIENCE data requesting photometric conditions are taken. A night is then defined as stable (S)
if
- the measurements cover an airmass range of more than 0.4 and
- the variation
of extinction coefficients is below 0.05 mag/airmass for v_HIGH and R_SPEC
and below 0.06 mag/airmass for b_HIGH.
In addition we check for the time range
covered by the measurements - if it is less than 1 hour the night is flagged
as Sb (for 'stable begin'). Nights with higher extinction variations
are marked as not-stable ('N'), while nights with an airmass
range of less than 0.4 or only one measurement are flagged as unknown ('U').
See Fig. 3 for a monitoring of the night stability.
The frame zeropoints are based on a single STD_IMA exposure. They are calculated assuming
a fixed extinction coefficient. A second result is calculated by the pipeline from
the same input data, this time the extinction coefficient assuming a fixed zeropoint
(see here).
Disclaimer: Do not
use these zeropoints for the reduction of science data. They have been processed
assuming standard extinction coefficients and colour terms, which may not be appropriate
for an individual night. Instead we recommend to use the instrumetal zeropoints
and extinction coefficients (available since 2012-06).
These coefficients were hardcoded in
the old pipeline (for data observed until 2008-03-31) and are tabulated in configuration
files for the new pipeline (for data observed since 2008-04-01). The coefficients
are frozen since 2011-11-28.
We
noticed a problem with some standard star field results, where the pipeline
mis-identified standard stars. Usually such mis-identifications are caught during
the QC certification process, but a few such cases (≤5%) have slipped through.
In such cases typically only few of the identified stars carry high weight. This
problem has been fixed with pipeline version 4.9.2, which has been in use since
2011-05-25.
QC1 parameters
- zeropoint per frame (QC1 database table fors2_zp_frame, column zp_frame)
The SExtractor software (Bertin & Arnouts, 1996,
A&A 117, 393) is run on the reduced images, to detect standard stars and to extract
their fluxes. A fixed aperture of 10" radius is used and flux from neighbouring
stars within this aperture is corrected. The
fluxes of the unsaturated stars are then converted from ADU per sec into electrons
per sec using the inverse gain stored as FITS keyword "HIERARCH ESO DET OUT1
CONAD". They are then corrected for atmospheric extinction and colour terms
using tabulated
coefficients. For the zero points per frame the optimally weighted average
of the zeropoints from the individual unsaturated stars is determined. The optimal
weights are determined in such a way, that the error on the frame zeropoint is minimised.
Individual zeropoints deviating more than either 0.3 mag or 5 σ from the mean
zeropoint are rejected as outliers, and the mean is re-determined.
- error of the zeropoint (QC1 database table
fors2_zp_frame, column sig_zp_frame)
This is the combination of the rms error of the individual zeropoints and the accumulated errors from the frames (raw frame, master bias, master twilight flat).
Trending
For the trending we
select only zeropoints with errors of less than 0.1 mag and with more than 1 standard
star found. In
the same plot we trend the error
of the frame zeropoints to check if outlying zeropoints have larger than usual
errors.
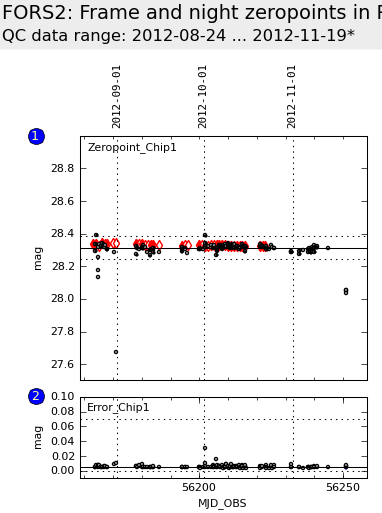 |
Fig. 1: Frame
zeropoints (black circles) and instrumental zeropoints (red diamonds). Data for stable
nights (flag 'S' or 'Sb') have filled symbols. The instrumental zeropoints are calculated
with a delay of 28 days. They represent the true current instrument zeropoint,
calculated with a measured extinction, while the frame zeropoint is calculated
assuming a specific, fixed extinction. |
History
- Washing or re-coating of mirrors affects the zeropoints
as do moves between telescopes.
- For the old FORS2 CCD (in operation until 2002-03) the conversion factors were read from the FITS keywords "HIERARCH ESO DET OUTi CONAD" with i = 1...4 and averaged over the four CCD ports.
- Until 2008-03-31, the old imaging pipeline was used, which determined the zeropoints as follows:
- zeropoint per frame (QC1 database table
fors2_zp_frame, column zp_frame)
SExtractor is run on the reduced images, to detect
standard stars and to extract their fluxes. A fixed aperture of 10" radius is used. The fluxes of the unsaturated stars are then converted from ADU per sec into electrons per sec using the FITS keyword "HIERARCH ESO DET OUT1 CONAD" and corrected for atmospheric extinction and colour terms using hardcoded coefficients. For the zero points per frame the average of the zeropoints from the individual unsaturated stars is determined. Zeropoints fainter than this average by more than 0.3 mag are excluded and the average is re-determined.
- error of the zeropoint (QC1 database table fors2_zp_frame, column sig_zp_frame)
This is the rms error of the frame zeropoint (0 in general means that there was just one standard star in the field)
- Until March 2006, the instrumental magnitudes
were estimated with the MIDAS integrate/aperture command instead of using the SExtractor
magnitudes from the pipeline, which were unrealiable due to an incorrect setting
of the SExtractor MASK parameter. The instrumental magnitudes were corrected for
extinction and colour using coefficients which were read
from the QC1
Database and updated after every period.
- Since April 2008 the new imaging pipeline has been in use. It uses the Stetson catalogue, which does not contain U band data. Therefore U_SPEC zeropoints are not available anymore.
- Since April 2009 the standard filter set contains R_BESS, I_BESS, b_HIGH, and v_HIGH.
- Since Nov 2011 the following extinction coefficients and zeropoints are used.
- Since Jun 2012 the V_2010-09 version of the Stetson catalogue is used. Also the SourceExtractor Parameters have been changed to
- DETECT_THRESH 1.5
- PHOT_APERTURES 40
- BACK_PHOTOTYPE LOCAL
- BACKPHOTO_THICK 30
- 2016-09-02 after M1 re-coating the zero points increased by about 0.2 mag in all filters
| top Extinction Coefficients per Frame |
QC1 parameters
- extinction coefficient (QC1 database table fors2_zp_frame, column ext_coeff)
Assuming a value for the zeropoint an extinction coefficient is derived. The values
assumed for the zeropoints can be found here.
If the assumed zeropoints are over/under-estimated, the derived extinction coefficients
are correspondingly shifted. The final values per stable night are calculated here.
- error of the extinction coefficient (QC1 database table fors2_zp_frame, column err_ext_coeff)
This is the rms error of the extinction coefficient.
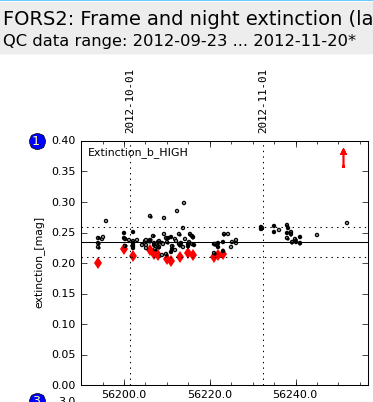 |
Fig. 2: Frame
extinction (black circles) and night extinction (red diamonds). Data for stable
nights (flag 'S' or 'Sb') have filled symbols. The night extinction for a specific
date is calculated with a delay of 28 days. The night extinction is displayed
for stable nights only, since it is defined only for those nights. It is the
true extinction coefficient for the considered night, applicable together with
the true instrumental zeropoint (Fig. 1). |
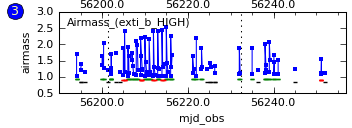 |
Fig. 3: Airmass
distribution for the nights with FORS2 photometry. All data points from the night
(per filter and chip) are grouped together and connected by line. This plot has
the colour coding for 'S' or 'Sb' nights (green, stable), 'N' (not stable, red),
and 'U' (unknown, black). See text for the criteria. |
History
- 2016-09-02 after M1 re-coating the zero points increased, which affected calculation of extiction; as a result, the extinction coefficients were systematically underestimated; it went back to normal within a month of resumed operations
| top Instrumental Zeropoints and Nightly Extinction Coefficients |
With a time delay of one month, we calculate in a second
step the instrumental zeropoints and extinction coefficients per stable night.
For
the instrumental zeropoints and extinction coefficients per night, we collect data
from at least 7 stable nights
around the night of interest. The combinations of high airmass coverage and stable
extinction for these nights allows us to determine a common zeropoint and nightly
extinction coefficients with the pipeline recipe fors_photometry. The zeropoint
and the extinction coefficient derived for the night of interest are stored in
the database table fors2_photometry.
We take care that data are not combined across mirror coatings.
The extinction coefficient for the night more accurately
refers to the times of the night when standard star images were taken. If, for instance,
only two standard star images were taken at the beginning of the night, the extinction
coefficient describes only the conditions for that short time interval (see here).
QC1 parameters
- instrumental zeropoint (QC1 database table
fors2_photometry, column zeropoint)
This is the zeropoint derived by the procedure described above. Since the recipe can determine the exticntion coefficient from the data this zeropoint should be free from atmospheric effects and reflects only changes in the instrument and/or telescope.
- error of the zeropoint (QC1 database table fors2_photometry, column zeropoint_err)
This is the rms error of the instrumental zeropoint.
- extinction coefficient for the night (QC1 database table fors2_photometry, column extinction)
This is the extinction coefficient derived for the night. It is defined only for stable nights.
- error of the extinction coefficient for the night (QC1
database table fors2_photometry,
column extinction_err)
This is the rms error of the extinction coefficient for the night.
Trending
For the trending we select only data from stable nights, since the fors_photometry recipe is very sensitive to variations of the extinction coefficient during the night, which may affect the determination of the instrumental zeropoint.
|
