|
|
 |
| |
| QC PLOTS |
| |
CURRENT |
HISTORY |
| image quality |
 |
 |
| QC1 database (advanced users):
browse
| plot |
Click on CURRENT to see the current trending (Health Check).
Click on HISTORY to see the historical evolution of the trending. |
Starting with May 2000 (P65), all reduced FORS2 science images taken in Service Mode are analyzed in order to estimate their Image Quality (hereafter IQ). This is done in a fully automatic way using a stand-alone procedure based on the Sextractor object detection algorithm (Bertin and Arnouts 1996 A&A 117,393). The estimated IQ is then logged into the QC1 database together with other parameters, like alt-az field coordinates, DIMM seeing (hereafter DS),wind speed, wind direction and so on.
Most of the IQ monitoring was done by processing science frames. With the rescoping of the QC group processes, science processing was terminated on Sep. 30, 2011, and so was the IQ trending. Still, the historical information could be useful.
QC1 parameters
- image quality (QC1 database table fors2_sci_img, column iq)
The SExtractor (Source Extractor) software (Bertin & Arnouts, 1996, A&A 117, 393) is run on the reduced images to detect the sources. Stars are identified based on Sextractor parameters (Stellarity Index > 0.5, ellipticity <0.5 and quality FLAG=0) and their FWHM is measured by the program. The mode of the FWHM distribution is defined as the image quality.
- error of the image quality (QC1 database table fors2_sci_img, column iq_rms)
This is the rms error of the image quality, estimated using a symmetric range |mode_seeing-minimum_seeing| on both sides of the mode seeing (so-called core of the distribution).
- average ellipticity (QC1 database table fors2_sci_img, column avg_ellipt)
The average ellipticty is calculated for those sources that have an image quality within the core of the seeing distribution (see above).
- corrected DIMM seeing (QC1 database table fors2_sci_img, column dimm_corr)
This is the average seeing observed by the DIMM, corrected to the airmass of the FORS2 observations. In addition the DIMM seeing is corrected to the wavelength of the FORS2 observations and also the different telescope diameters are taken into account, following the prescriptions by Marc Sarazin.
Trending
Only IQ measurements obtained with the Standard Resolution (SR) collimator and taken through the broad-band UBVRI filters are trended. To reduce the uncertainty, only image quality values are plotted, which result from more than 10 stars and have at at least one DIMM seeing measurement during their exposure time. To avoid a bias from deep exposures, where galaxies dominate the field, we require in addition that the average ellipticity is less than 0.3 and the rms of the image quality is below 0.2.
 |
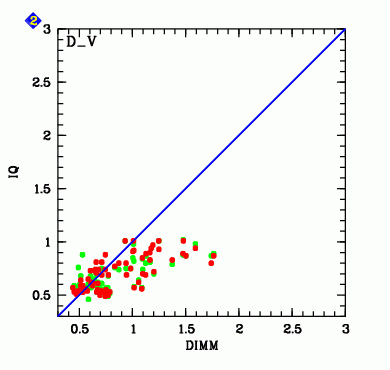
This plot shows the observed image quality for the V_BESS filter (red/green dots: 2 CCDs) vs. the corrected DIMM seeing. The blue line gives the 1:1 relation. Obviously the FORS2 image quality tends to be better than the DIMM seeing for DIMM seeing > 1.2".
IMPORTANT NOTE: The Standard Resolution (SR) collimator produces a detector scale of 0".25/pixel (2x2 binning with new CCDs). When the seeing is less than 0".4-0".5 this leads to some significative undersampling of the Point Spread Function (PSF). Even though Sextractor applies a correction for undersampling effects down to a FWHM=1 pixel (assuming an underlying gaussian PSF), a residual effect is expected in the region of excellent seeing.
|
|
![[ ESO ]](/images/eso-logo.gif)
![[ ESO ]](/images/eso-logo.gif)
