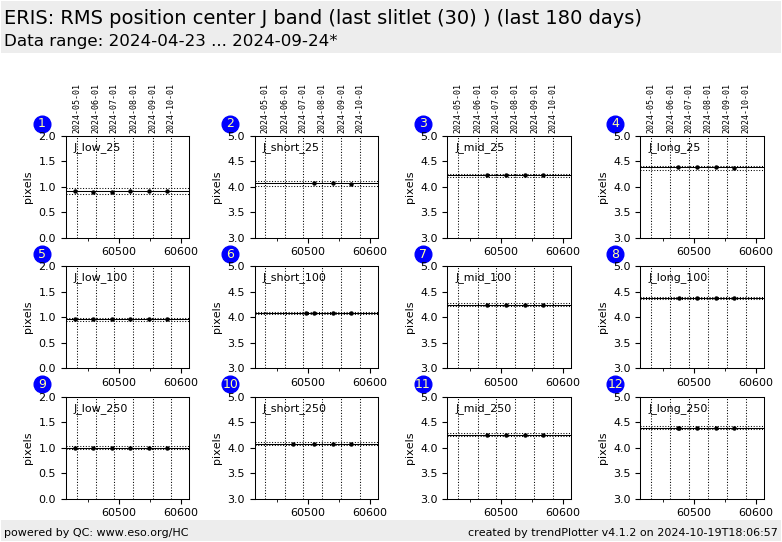
ERIS trending system: HEALTH CHECK report
Last update: 2024-10-19T18:07:09 (UT)
[enable javascript for displaying time difference!]
General news:
NOTE: The Health Check and calChecker services are moved to qcFlow on an instrument by instrument basis. The current pages will not be updated any longer once the move has been finished.
ERIS news:
Report news:
Plot? Symb? Source Average ? Thresholds ? N_ QC1 Data Remarks
method value unit method value
1
• QC1DB MEDIAN 0.916 pixels VAL 0.851,0.982 6 qc_s30_C_stdev
this |
last_yr |
all
width_slitlet31_right (pixels):: J_low/25 mas scale
2
• QC1DB MEDIAN 4.07 pixels VAL 4.0079,4.1063 3 qc_s30_C_stdev
this |
last_yr |
all
width_slitlet31_right (pixels):: J_short/25 mas scale
3
• QC1DB MEDIAN 4.23 pixels VAL 4.1846,4.2564 4 qc_s30_C_stdev
this |
last_yr |
all
width_slitlet31_right (pixels):: J_middle/25 mas scale
4
• QC1DB MEDIAN 4.38 pixels VAL 4.3281,4.4103 4 qc_s30_C_stdev
this |
last_yr |
all
width_slitlet31_right (pixels):: J_long/25 mas scale
5
• QC1DB MEDIAN 0.96 pixels VAL 0.9338,0.988 6 qc_s30_C_stdev
this |
last_yr |
all
width_slitlet31_right (pixels):: J_low/100 mas scale
6
• QC1DB MEDIAN 4.08 pixels VAL 4.0612,4.1002 4 qc_s30_C_stdev
this |
last_yr |
all
width_slitlet31_right (pixels):: J_short/100 mas scale
7
• QC1DB MEDIAN 4.24 pixels VAL 4.2226,4.2688 4 qc_s30_C_stdev
this |
last_yr |
all
width_slitlet31_right (pixels):: J_middle/100 mas scale
8
• QC1DB MEDIAN 4.38 pixels VAL 4.3644,4.3985 4 qc_s30_C_stdev
this |
last_yr |
all
width_slitlet31_right (pixels):: J_long/100 mas scale
9
• QC1DB MEDIAN 0.99 pixels VAL 0.9632,1.0252 6 qc_s30_C_stdev
this |
last_yr |
all
width_slitlet31_right (pixels):: J_low/250 mas scale
10
• QC1DB MEDIAN 4.07 pixels VAL 4.0425,4.1171 4 qc_s30_C_stdev
this |
last_yr |
all
width_slitlet31_right (pixels):: J_short/250 mas scale
11
• QC1DB MEDIAN 4.25 pixels VAL 4.2201,4.2784 4 qc_s30_C_stdev
this |
last_yr |
all
width_slitlet31_right (pixels):: J_middle/250 mas scale
12
• QC1DB MEDIAN 4.39 pixels VAL 4.3657,4.4215 5 qc_s30_C_stdev
this |
last_yr |
all
width_slitlet31_right (pixels):: J_long/250 mas scale
*Data sources: QC1DB: QC1 database; LOCAL: local data source
Plot 1 scores: 1 |
data source: eris_ifu_distortion dataset: qc_s30_C_stdev • median: 0.916 pixels fixed thresholds: 0.851...0.982 pixels N_data plotted: 6 [click plot for closeup]
Plot 2 scores: 1 |
data source: eris_ifu_distortion dataset: qc_s30_C_stdev • median: 4.07 pixels fixed thresholds: 4.0079...4.1063 pixels N_data plotted: 3 [click plot for closeup]
Plot 3 scores: 1 |
data source: eris_ifu_distortion dataset: qc_s30_C_stdev • median: 4.23 pixels fixed thresholds: 4.1846...4.2564 pixels N_data plotted: 4 [click plot for closeup]
Plot 4 scores: 1 |
data source: eris_ifu_distortion dataset: qc_s30_C_stdev • median: 4.38 pixels fixed thresholds: 4.3281...4.4103 pixels N_data plotted: 4 [click plot for closeup]
Plot 5 scores: 1 |
data source: eris_ifu_distortion dataset: qc_s30_C_stdev • median: 0.96 pixels fixed thresholds: 0.9338...0.988 pixels N_data plotted: 6 [click plot for closeup]
Plot 6 scores: 1 |
data source: eris_ifu_distortion dataset: qc_s30_C_stdev • median: 4.08 pixels fixed thresholds: 4.0612...4.1002 pixels N_data plotted: 4 [click plot for closeup]
Plot 7 scores: 1 |
data source: eris_ifu_distortion dataset: qc_s30_C_stdev • median: 4.24 pixels fixed thresholds: 4.2226...4.2688 pixels N_data plotted: 4 [click plot for closeup]
Plot 8 scores: 1 |
data source: eris_ifu_distortion dataset: qc_s30_C_stdev • median: 4.38 pixels fixed thresholds: 4.3644...4.3985 pixels N_data plotted: 4 [click plot for closeup]
Plot 9 scores: 1 |
data source: eris_ifu_distortion dataset: qc_s30_C_stdev • median: 0.99 pixels fixed thresholds: 0.9632...1.0252 pixels N_data plotted: 6 [click plot for closeup]
Plot 10 scores: 1 |
data source: eris_ifu_distortion dataset: qc_s30_C_stdev • median: 4.07 pixels fixed thresholds: 4.0425...4.1171 pixels N_data plotted: 4 [click plot for closeup]
Plot 11 scores: 1 |
data source: eris_ifu_distortion dataset: qc_s30_C_stdev • median: 4.25 pixels fixed thresholds: 4.2201...4.2784 pixels N_data plotted: 4 [click plot for closeup]
Plot 12 scores: 1 |
data source: eris_ifu_distortion dataset: qc_s30_C_stdev • median: 4.39 pixels fixed thresholds: 4.3657...4.4215 pixels N_data plotted: 5 [click plot for closeup]
General information
Click on any of the plots to see a close-up version .
The latest date is indicated on top of the plot.
If configured,
data points belonging to the latest date are specially marked statistical averages are indicated by a solid line, and thresholds by broken lines outliers are marked by a red asterisk. They are defined as data points outside the
threshold lines "aliens" (= data points outside the plot Y limits) are marked by a red arrow (↑ ↓ you can download the data for each parameter set if the 'Data downloads' link shows up
