[an error occurred while processing this directive]
General news:
NOTE: The Health Check and calChecker services are moved to qcFlow on an instrument by instrument basis. The current pages will not be updated any longer once the move has been finished.
The links to KMOS, UVES, and ESPRESSO have been moved to a new section (qcFlow operational) at the lower part of the navigation bar.
*Data sources: QC1DB: QC1 database; LOCAL: local text file | **OPS: to indicate that OPSLOG data are included
Plot 1 scores: [an error occurred while processing this directive]
data source:
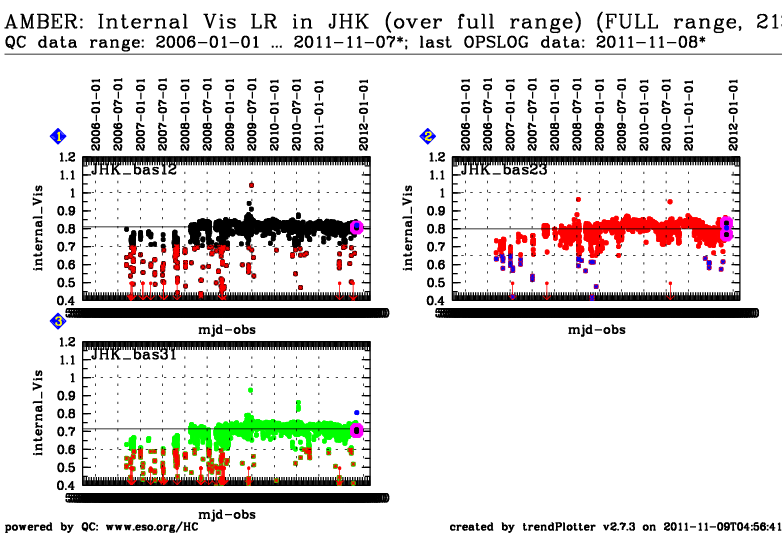
amber_p2vm (QC1 database)
dataset:
meas_int_Vis_base12
•
median:
0.81036
NONE
fixed thresholds:
0.7...1.0
NONE
N_data plotted:
2144
[click on plot for closeup]
Plot 2 scores: [an error occurred while processing this directive]
data source:
amber_p2vm (QC1 database)
dataset:
meas_int_Vis_base23
•
median:
0.799
NONE
fixed thresholds:
0.65...1.0
NONE
N_data plotted:
2135
[click on plot for closeup]
Plot 3 scores: [an error occurred while processing this directive]
data source:
amber_p2vm (QC1 database)
dataset:
meas_int_Vis_base31
•
median:
0.71452
NONE
fixed thresholds:
0.6...1.0
NONE
N_data plotted:
2135
[click on plot for closeup]
This plot
The P2VM (Pixel to Visibility Matrix) is used to calibrate the science data. The pipeline product provides also some QC parameters which are used to monitor the Instrumental transfer function and the offset between the photometric beams.
In Low resolution JHK, the Instrumental Visibility is calculated across the full JHK spectrum (this plot) or in the individual bands (J, H and K). The band K,H,J Instrumental Visibilities are shown in the HC plots: K_P2VM_LJHK, H_P2VM_LJHK, J_P2VM_LJH.
The HC plot "with_temp" is a long range plot where the temperature inside the
lab is also plotted. This could show some correlation etween internal
Visibility and temperature (see also environment HC plots under Non Daily)
General information
Click on any of the plots to see a close-up version.
If applicable, the latest values from Paranal ops logs are plotted as blue dots. More information about those values, including a download option, is available in the OPS column.
The latest date is indicated on top of the plot, data points belonging to that date are specially marked.
If configured,
statistical averages are indicated by a solid line, and thresholds by broken lines
outliers are marked by a red asterisk. They are defined as data points outside the
threshold lines
"aliens" (= data points outside the plot Y limits) are marked by a red arrow (↑ or ↓)
you can download the data for each parameter set if the 'Data downloads' link shows up
