1. Definitions
- Widget
Display or Control element of a GUI. Widgets present data or information to the user of the GUI, and implement interaction capturing input from the user, making it available for the application to process. Widgets are intended to be a small unit of a GUI, that can be reused.
- Composite widget
a widget that is implemented by composing several other smaller widgets. Implementing a composite widget commonly achieves a complex tasks by cooperation between its parts.
- Sequential Programming
a programming paradigm in which the flow of control is predetermined by a sequence of instructions.
- Asynchronous Programming
a programming paradigm in which the program reacts to events. Different kinds of inputs can be translated into events, such as key strokes, mouse movements, network connection status, battery level, etc.
Note: Asynchronous programming is not restricted by multi-threading, but some long running responses to events certainly benefit from it.
- Event Loop/Engine/Pump
Asynchronous Programming needs to implement an additional section of the program that gathers input, creates events, and trigger the responses to those events. One possible implementation of this, and the one that Qt uses, is an Event Loop (See QEventLoop).
2. Conventions
Note
Through this document, the author will refer to widgets by name using the following notation: TextOnTheWidget kindOfWidget
For example: Accept button or Open File dialog
Note
When referencing code, like methods or class names, this notation will be used closeEvent(QEvent *event).
Note
Executable programs will be depicted like this cut-demo-service.
Note
Disclaimer: Several of the examples exposed in this document are modifications to examples found in the Taurus Developers Guide.
3. Using CUT
CUT comes preinstalled with DevEnv as rpm package elt-cut version 1.3.0-pre1. To check the installed version please execute:
rpm -qi elt-cut
In order to use CUT, its lua module file needs to be loaded. This is automatically done by DevEnv for you. To check please execute:
module list
Tip
In case you need a local VM, we suggest to use vagrant. CUT has a Vagrant module that is able to provide a local VM.
CUT makes use of CII OLDB services, so please have them configured and running.
The cut-demo-service is provided as part of the installation. This cut-demo-service publishes a set of datapoints both to OLDB and PS. The cut-demo-service will be used through this document, functioning as a server. To start it:
cut-demo-service
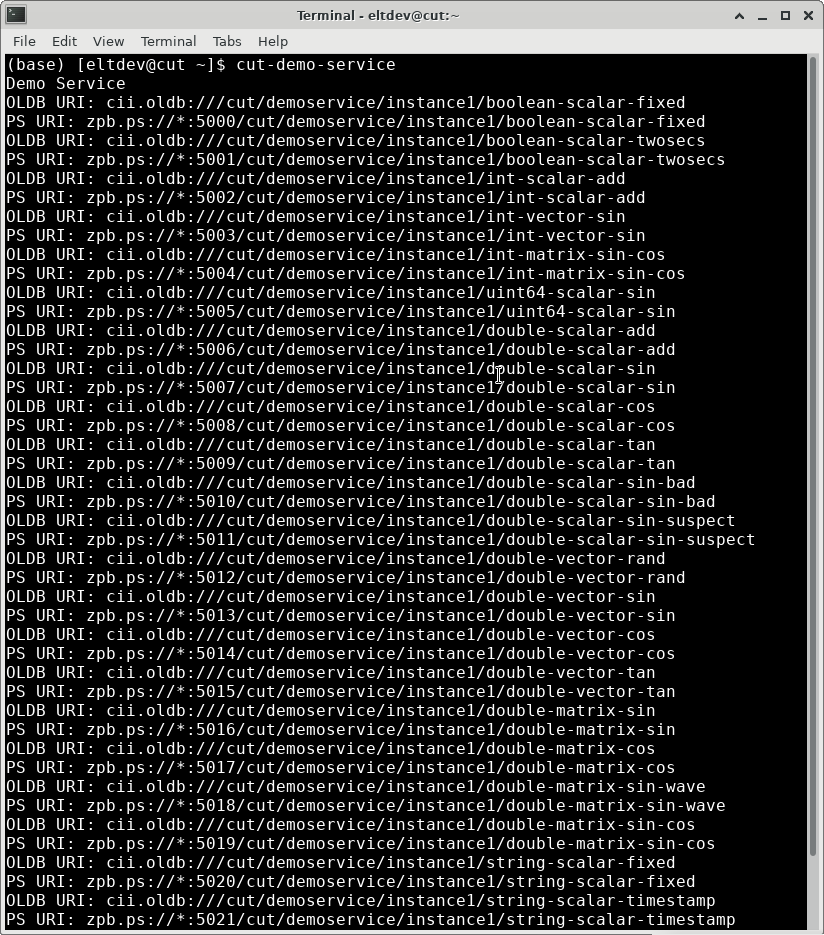
Output of cut-demo-service.
Keep this program running as its serves the datapoints needed for this tutorial. Please open a new terminal or a new tab so that we can continue with the workshop. To exit press Enter as indicated.
To quickly check if CUT is working, please execute these two lines separately:
taurus form 'eval:rand()'
taurus form 'cii.oldb:/cut/demoservice/instance1/double-scalar-add'
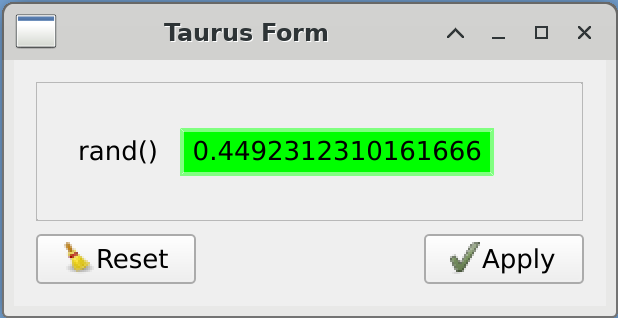
Taurus form view for eval:rand()
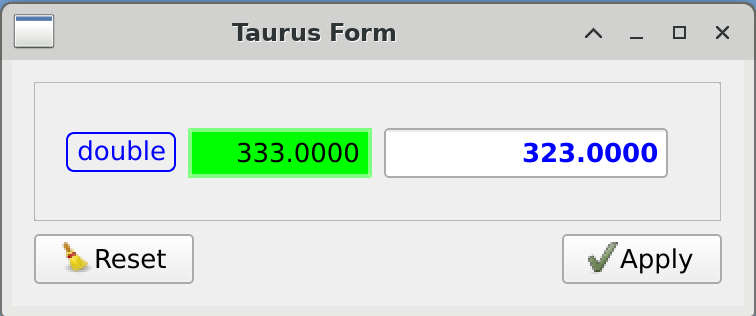
Taurus form view for cii.oldb:/cut/demoservice/instance1/double-scalar-add
4. Python
CUT uses Python as primary language. Though it can be extended through C++, it is intended to be easy to use, and quick to develop applications.
Python in an interpreted language, and the python and ipython allow us to explore this nature of the language in more details. When you enter a python interpreter, you can enter line by line what methods you want to execute.
You can also copy & paste an existing python code, and enter it into the interpreter. We will do this several times in this document.
Python make is very strict with indentation and spaces. These are used to indicate blocks of code (very similar to {} in C++). The definition of a class, a method, if, and for statement, all end with the : (colon) sign. This opens a new block of code, and it is required to enter 4 spaces in the next line. Python accepts tabs, or any number of spaces greater than 1, but by coding standard, we recommend 4.
If you do not want to put code in an if statement, you can use pass instruction, to indicate that we end this code block.
1 2 3 4 5 6 7 8 9 10 11 | #!/opt/anaconda3/bin/python
def a_function(arg1):
print("Hello World!")
if(arg1):
pass
else:
print("Bye, bye!")
a_function(True)
a_function(False)
a_function()
|
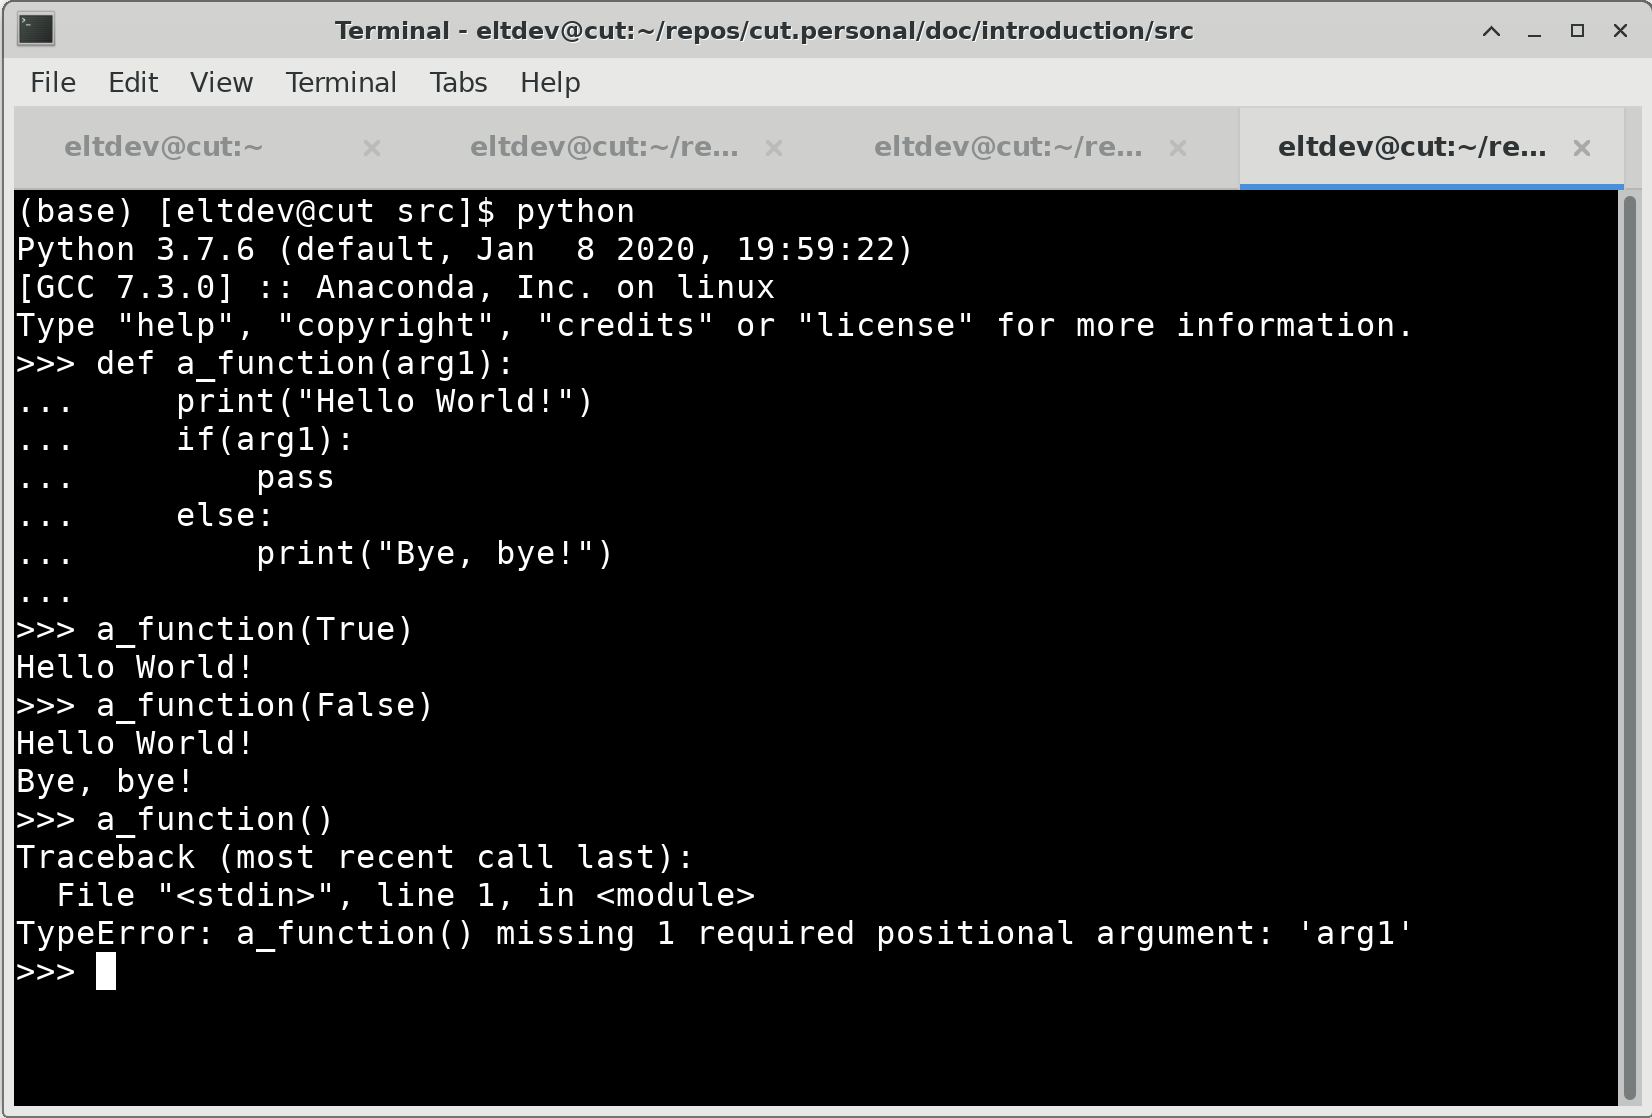
Output of the example above.
You can see from the example above that Python is not a strongly typed language. The function has not definition of the type of its argument, and if no argument is passed, the function fails, because it cannot access arg1.
It is very important in Python to check for this kind of behaviors.
5. Qt
Qt is an application development framework. It includes libraries to process sound, text, databases, and the most important: to create UIs. It is written in C++, and has two set of bindings to Python, being PySide the one developed by Qt. PyQt5 is also very popular, but due to licensing issues, we cannot use it.
Important
When searching for documentation and examples, please use the keyword PySide2. Most of the code examples
you see in the Internet include examples for both, but always refer to PySide2 examples.
Qt in an asynchronous engine. A developer creates a main.py file that serves as entry point for the Qt Application we develop. This application generates the first and most important UI element, and then enters Qt’s event engine. From then on, all execution happens in one thread, asynchronously.
1 2 3 4 5 6 7 8 9 10 11 | #!/opt/anaconda3/bin/python
import sys
from PySide2.QtWidgets import QApplication
from PySide2.QtWidgets import QLabel
if __name__ == "__main__":
app = QApplication(sys.argv)
widget = QLabel()
widget.setText("Hello World!")
widget.show()
sys.exit(app.exec_())
|
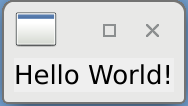
Qt Hello World! example output
Every Qt application needs a QApplication object. There can be only one per process. At this point, you can add widgets, like a QLabel, modify properties of the widget (setText("Hello World!")), and command it to be shown.
5.1. Signals - part 1
At this point, something interesting happens. A new windows appear, but it is empty. It is not until the execution of app.exec_() that the window start to be drawn. At this point the application has entered Qt event engine. It will not exit the event engine until an event that indicates an exit condition, or a signal is invoked to exit. When that happens, the app.exec_() method returns, and we exit the Python program using sys.exit().
A Developer must understand that events will be the drivers of the application behaviors from then one. Mouse clicks and key presses will be registered by Qt, and for each interaction, an event will be generated and entered into a queue. Then, Qt’s event engine will take the latest one, and process it.
Following the example above, if a user of this application closes the window, the application will exit. This happens because the window was commanded to be closes by the window manager, which creates an event, the event is fed to the QLabel, which by default reacts to QCloseEvent by closing the window. Since there is no more objects capable of handling and creating events in the application, the Qt engine event also automatically exits.
Note
Qt Applications can also be console applications. In this case, the application can be commanded to be exited by using qApp.quit(). This can also be done in GUI applications. See QCoreApplication.quit()
If a mouse click was done over a widget, Qt will inform of this event to the Window contained by the widget, and pass the coordinates. The Window will check the coordinate, determine which widget is located at those coordinates, and inform the widget of the event. Then the widget will do what is requested of it when a mouse click is detected.
A developer of GUIs should no go much into the details of implementing new events, but instead should use their product: Signals. When the mouse click is processed by the widget, this physical representation of the mouse click generates Signals, which are useful representations of what is happening of the GUIs. A button that gets a mouse click will generate a clicked Signal.
Then, the developer not program against events, but against Signals. As developers, we program applications reacts to Signals. Signals are already provided by Qt, and we react to them by connecting a Signal to a Slot.
When a Signal is connected to a Slot, Qt event engine will automatically invoke the Slot method.
1 2 3 4 5 6 7 8 9 10 11 12 13 | #!/opt/anaconda3/bin/python
import sys
from PySide2.QtWidgets import QApplication
from PySide2.QtWidgets import QPushButton
if __name__ == "__main__":
app = QApplication(sys.argv)
widget = QPushButton()
widget.setCheckable(True)
widget.clicked.connect(app.quit)
widget.setText("If you press this button\n the application will quit")
widget.show()
sys.exit(app.exec_())
|
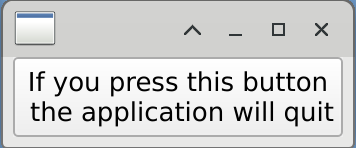
Signal Slot basic connection
This case is rather simple: QPushButton.clicked() signal is actually inherited from QAbstractButton class. Signals have a method connect() which accepts as argument the Slot which will be executed.
Now, when the user of the application click the button, app.quit() will be execute, and therefore the application ends.
5.2. Layouts
At this point we can create one widget, and show it. But this is seldom the case. To create an application with more than widget we use Layouts.
1 2 3 4 5 6 7 8 9 10 11 12 13 14 15 16 17 18 19 20 21 | #!/opt/anaconda3/bin/python
import sys
from PySide2.QtWidgets import QApplication
from PySide2.QtWidgets import QWidget
from PySide2.QtWidgets import QPushButton
from PySide2.QtWidgets import QLineEdit
from PySide2.QtWidgets import QHBoxLayout
if __name__ == "__main__":
app = QApplication(sys.argv)
panel = QWidget()
layout = QHBoxLayout()
widget1 = QPushButton(panel)
widget1.setText("Push me!")
widget2 = QLineEdit(panel)
widget2.setText("Enter text here")
layout.addWidget(widget1)
layout.addWidget(widget2)
panel.setLayout(layout)
panel.show()
sys.exit(app.exec_())
|
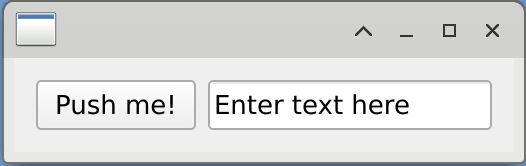
Two widgets in one application
In this example, we can see three widgets: a QWidget used as container, a QPushButton, and a QLineEdit. A new kind of object is created, the QHBoxLayout. The QHBoxLayout puts every widget added to it in an horizontal row. Most of the times the widgets in the layout will be equally sized (at least horizontally).
Then, this layout is set to panel, and instead of using show() in each widget, we do it in the topmost widget.
Layouts are used to ensure elasticity of the application, so that it reforms itself when the size of the window is changed, and to avoid leaving empty spaces. Specifying location of widget using coordinates is a really bad practice, which can hide elements of the UI when the window is smaller that its design, and leaves empty spaces when it is bigger.
5.3. Signals - part 2
Continuing with the example above, we have connected the two widgets from the example above. From the QLineEdit, we use Signal textChanged(str), and we connect it to the slot setText(str) from QPushButton.
1 2 3 4 5 6 7 8 9 10 11 12 13 14 15 16 17 18 19 20 21 22 | #!/opt/anaconda3/bin/python
import sys
from PySide2.QtWidgets import QApplication
from PySide2.QtWidgets import QWidget
from PySide2.QtWidgets import QPushButton
from PySide2.QtWidgets import QLineEdit
from PySide2.QtWidgets import QHBoxLayout
if __name__ == "__main__":
app = QApplication(sys.argv)
panel = QWidget()
layout = QHBoxLayout()
widget1 = QLineEdit(panel)
widget1.setText("Enter text here, and see")
widget2 = QPushButton(panel)
widget2.setText("Wait for it...")
widget1.textChanged.connect(widget2.setText)
layout.addWidget(widget1)
layout.addWidget(widget2)
panel.setLayout(layout)
panel.show()
sys.exit(app.exec_())
|
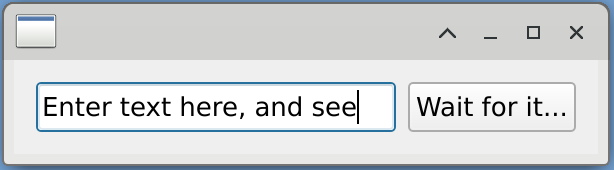
Widget to widget Signal Slot connection
Signal textChanged is fired every time the text changes, and has one string argument. On the other hand, setText slot also has one string argument.
Important
Signal and Slot signature must match.
6. Taurus
Taurus is a UI framework oriented to control systems. It is design using the Model View Controller pattern in mind, and offers a model with a plugin-based design capable of accessing multiples middlewares.
Taurus is developed under Python, and uses Qt as its UI toolkit library. CUT uses Taurus as it offers an extendible toolkit to develop UIs, which is easy to use.
6.1. Model View Controller Pattern
Taurus is an MVC pattern based UI Framework. The MVC pattern aims for re-usability of components, and the modularization of development.
Re-usability: it is achieved by the separation of the Model. The Model should be able to plug into most controller and views, by sharing a common interface.
Modularization: Since all views are able to present the model, development can be modularized. A new view can be developed, without loosing functionality of the other view. The Model can be expanded, but since the interface is preset, the view will just show a new widget.
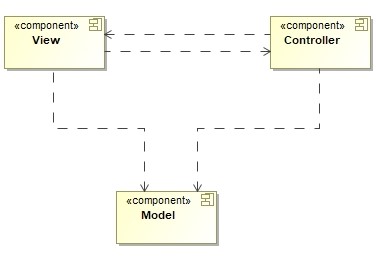
MVC Component Diagram
The Model is a section of data from the domain of the application. Responsibilities of this class are:
Contain the data
Knows how to read from its source
Knows how to write it back to its source
Translates any metadata into usable Roles
As an example, a model can be, for a motor: the encoder value, brake state, power state, incoming voltage, speed, acceleration.
Another example, from a database, the results the query SELECT * FROM table_students;. Each column in the result will be a Role, and each row will represent a new item, each with its Roles according to columns.
The View presents to the user the data from the model. Among its responsibilities:
Takes a subset of entries in the model, and presents it.
Determines the layout of the presentation (list, table, tree, heterogeneous, etc)
Each piece of data can use a different Widget, these are called Delegates.
Examples of views: List, ComboBox, Table, Tree, Columns
The Controller takes the inputs from the user, and makes the necessary changes to the model. Responsibilities these classes have:
Keeps references to Model and View.
Process input from the user, converting it to domain compatible notations.
Can also alter the user input.
Can manipulate the model, so it changes what is presented.
6.2. URI
Every part of a Taurus model (Attributes, Device, Authority), are identified by a URI. The URI has several parts:
cii.oldb:/cut/demoservice/instance1/sin
cii.oldbscheme:/authority/cut/demoservice/instance1devicesinattribute
The scheme normally indicates the transport and message protocol, but in taurus is used also to identify which Taurus model plugin should handle this model.
The authority here is almost empty. CII OLDB only allows one OLDB in the environment. But here, a different protocol could reference a particular server.
The device represents a physical device that is able to measure a physical phenomena, or is able to actuate on a device. In terms of software, is a container for attributes and methods.
The attribute is the representation of a measurement.
6.3. Taurus Model
The Taurus Model is not a complex one, and also it is not based on QAbstractItemModel Qt class.
It is located in the taurus.core module, as a set of 5 partially virtual classes. 3 of these classes, form a tree-like structure:
Authority
├---Device1
|   ├---- Attribute1
|   └---- Attribute2
└---Device2
    ├---- Device3
    |     ├---- Attribute3
    |     └---- Attribute4
    └---- Device4
          ├---- Attribute5
          └---- Attribute6
TaurusModel, the base class for all model elements.
TaurusDevice, which represents branches in a tree like structure.
TaurusAttribute, which represents leaves in this tree like structure.
TaurusAuthority, it represents a database of information about the control system.
TaurusFactory, is in charge of preparing an instance of one of the 4 classes above. It will also use NameValidator to figure is a particular URI is well constructed or not, and which kind of class should it return.
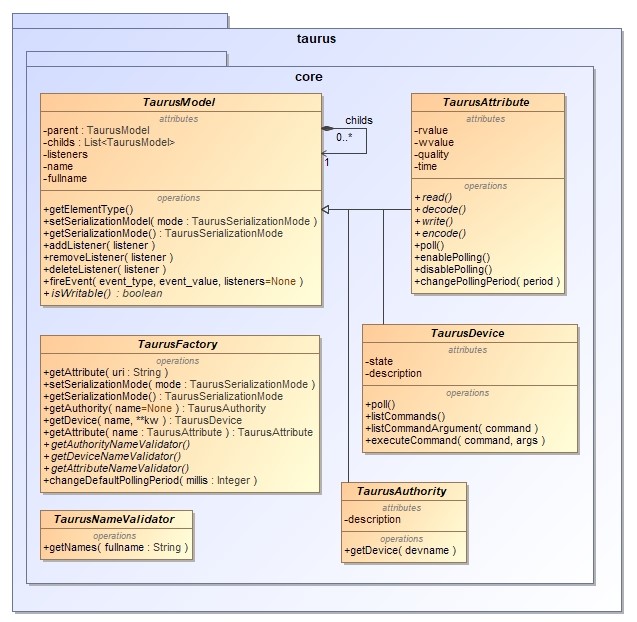
Class Diagram of the taurus.core module. TaurusAttribute, TaurusDevice and TaurusAuthority all inherit from the same parent, the TaurusModel class.
TaurusModel base class and TaurusDevice class implements a Composition pattern: Any device can have multiple children, but attributes cannot.
Important
The use of the Composition pattern has two purposes: Have a tree like structure of Authority, Devices and Attributes, while at the same moment, being able to access them all in the same way.
The TaurusFactory in the model provides an Abstract Factory pattern, that will provide most of the logic to create the needed entities, but specifics are left to a particular scheme plugin.
By itself, taurus.core classes do not allow access to any control system. They are partially virtual, so they must be fully realized before use. Taurus includes models for tango, epics, h5file, tangoarchiving, pandas and eval. CUT provides an CII OLDB plugin, and in the future will support MAL Reply Request, MAL Subscriptions, CII Engineering Archive and CII Configuration.
6.3.1. Model Plugins
A series of data models allows Taurus access to different backends. In particular, through this document, we will be presenting example that make use of two of them:
evaluation is provided by Taurus. This model executes Python code, and translate the return value as best as possible to TaurusAttribute. It is a read-only model.
cii.oldb part of the Control UI Toolkit, this module allows read/write access to CII OLDB service, as TaurusAttribute.
To access the OLDB plugin, we can use directly the OLDB Factory from the plugin. Most of the datapoints offered by cut-demo-service are dynamic, so expect different values.
1 2 3 4 5 6 7 | #!/opt/anaconda3/bin/python
import taurus
from tauruscii.taurusciifactory import TaurusCiiFactory
uri = 'cii.oldb:/cut/demoservice/instance1/double-scalar-cos'
attr = TaurusCiiFactory().getAttribute(uri)
print(attr.rvalue)
|
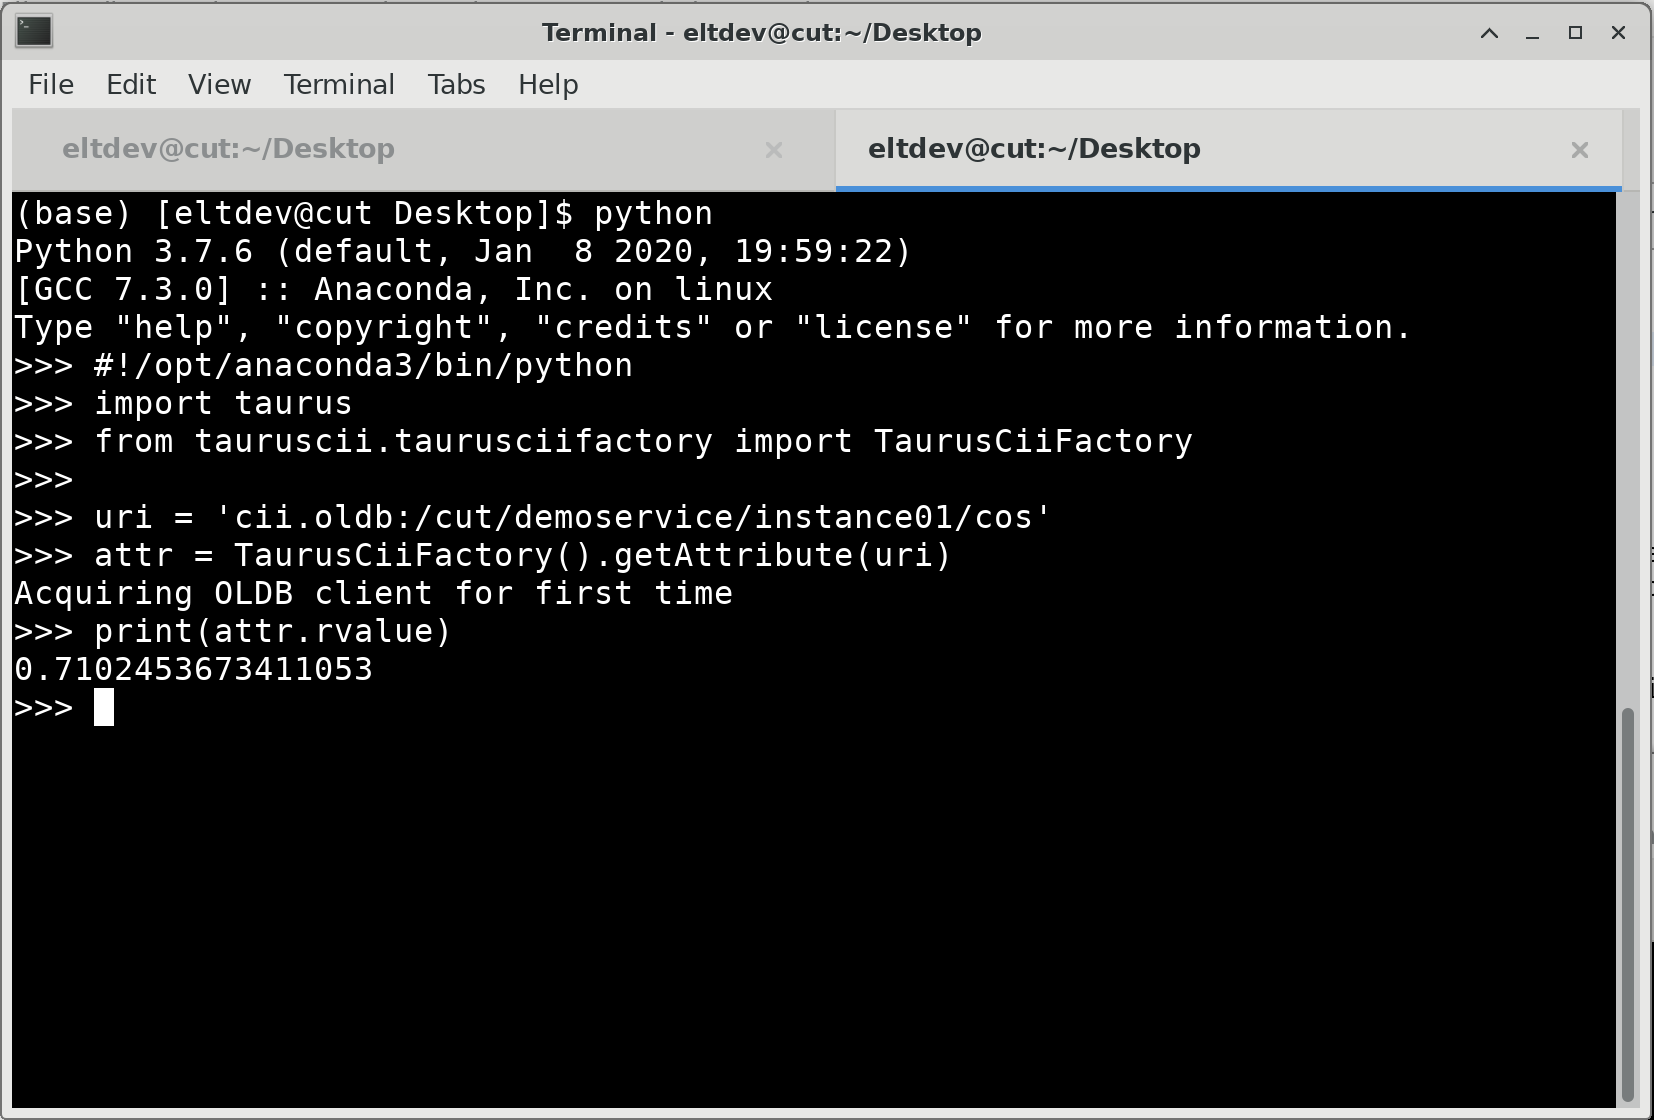
Terminal output of the script above. Values may differ in your execution.
But we should use Taurus Factories, so it can solve within all available model plugins.
1 2 3 4 5 6 7 8 9 | #!/opt/anaconda3/bin/python
import time
from taurus import Attribute
sine = Attribute('cii.oldb:/cut/demoservice/instance1/double-scalar-sin')
sine.forceListening()
while(True):
time.sleep(1)
print(sine.rvalue)
|
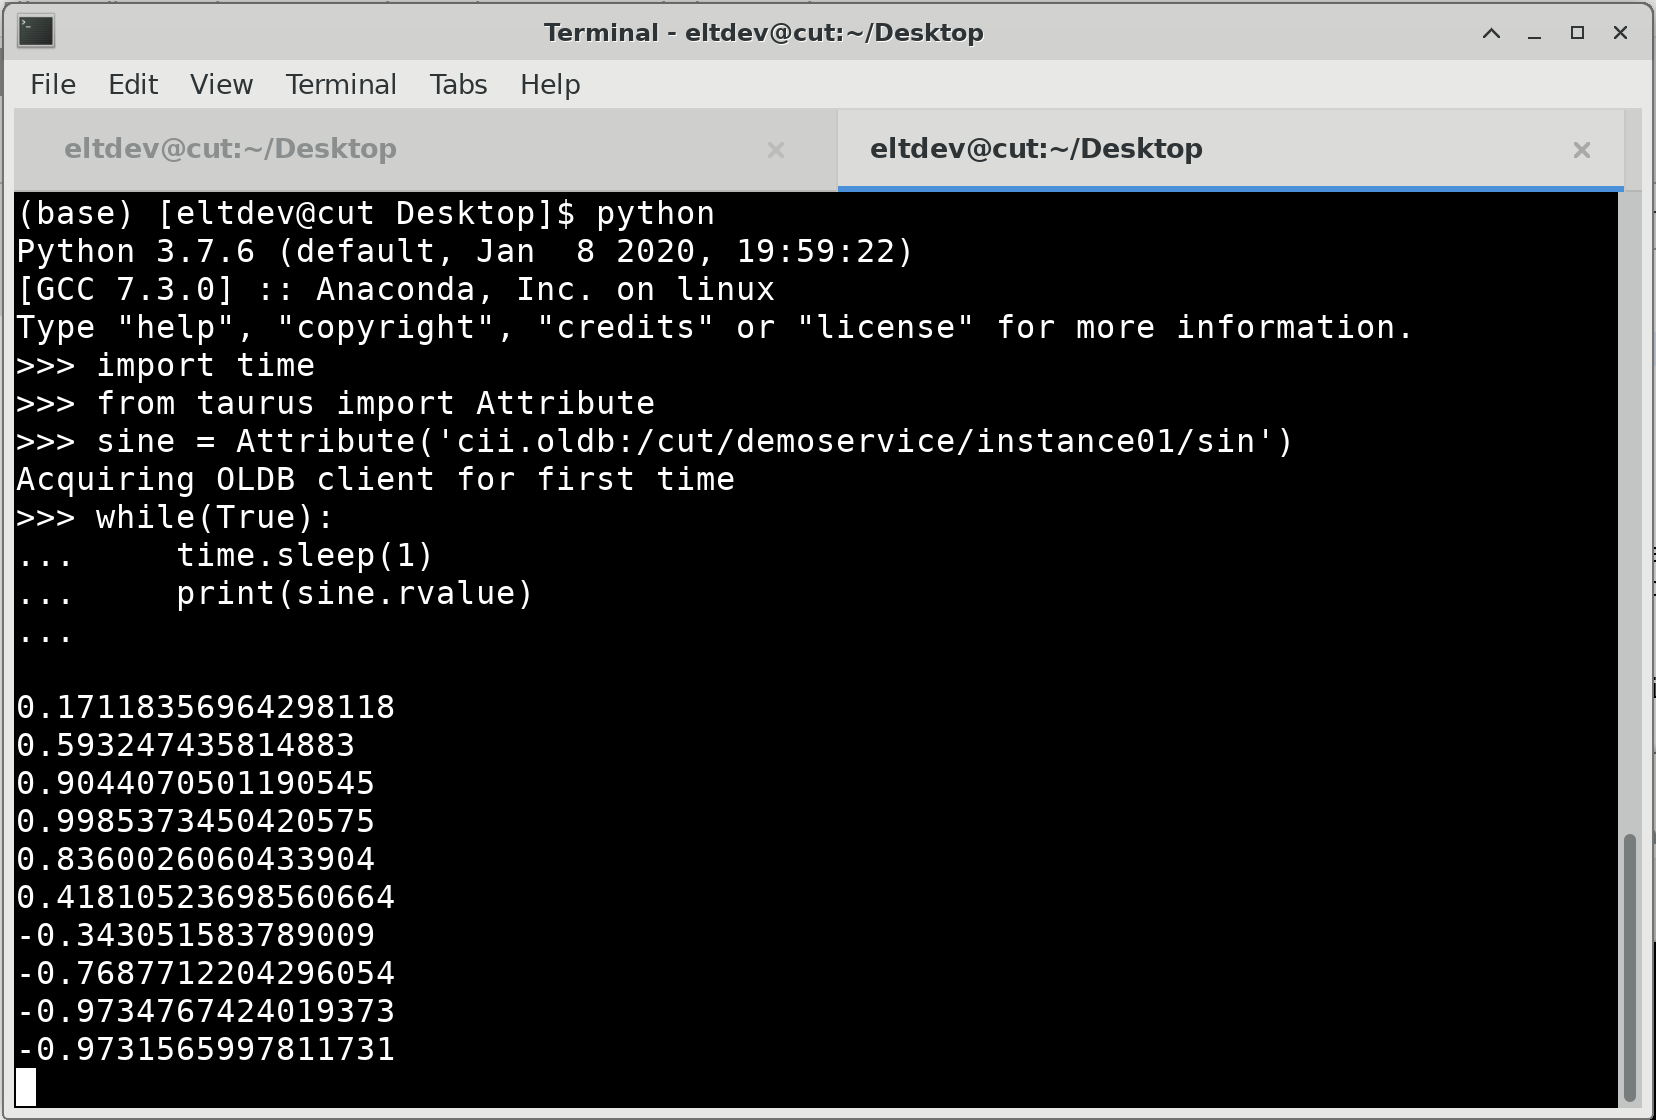
Terminal output of the script above. Values may differ in your execution.
Using the URI, the TaurusFactory will find out the scheme for the attribute.
Using the matching plugin, it will request instances of the CiiFactory and CiiValidator.
Will check the validity of the URI using the CiiValidator
And the create the attribute using the CiiFactory.
Every instance of a particular URI, is a singleton. So is we were to again request for taurus.Attribute('cii.oldb:/cut/demoservice/instance1/double-scalar-sin'), we would get a reference to the previous object.
Tip
The developer can access taurus.Attribute manually. The models for widgets are expressed as strings of URIs, and is the responsibility of the widget to get an instance to the proper taurus.Attribute class, through the use of taurus.Authority.
This can be helpful while development more complex commands or methods.
You can obtain several pieces of information from the metadata stored in the OLDB. This examples shows you what you can get:
1 2 3 4 5 6 7 8 9 10 11 12 13 14 15 16 | #!/opt/anaconda3/bin/python
from taurus import Attribute
sine_value = Attribute('cii.oldb:/cut/demoservice/instance1/double-scalar-sin')
sine_value._connect()
print('sine value: %f'% (sine_value.rvalue.magnitude))
print('sine alarm ranges: ]%s, %s['% (sine_value.alarms[0], sine_value.alarms[1]))
print('sine units: %s'% (sine_value.rvalue.units))
print('sine datapoint description: %s' % (sine_value.description))
print('sine uri: %s' % (sine_value.fullname))
print('sine label: %s' % (sine_value.label))
print('Can we write into sine?: %s' % (sine_value.isWritable()))
#Tip: You can stop the cut-demo-service app for a bit.
sine_value.write(0.5)
print( sine_value.read() )
print('sine quality: %s' % (sine_value.quality.name))
|
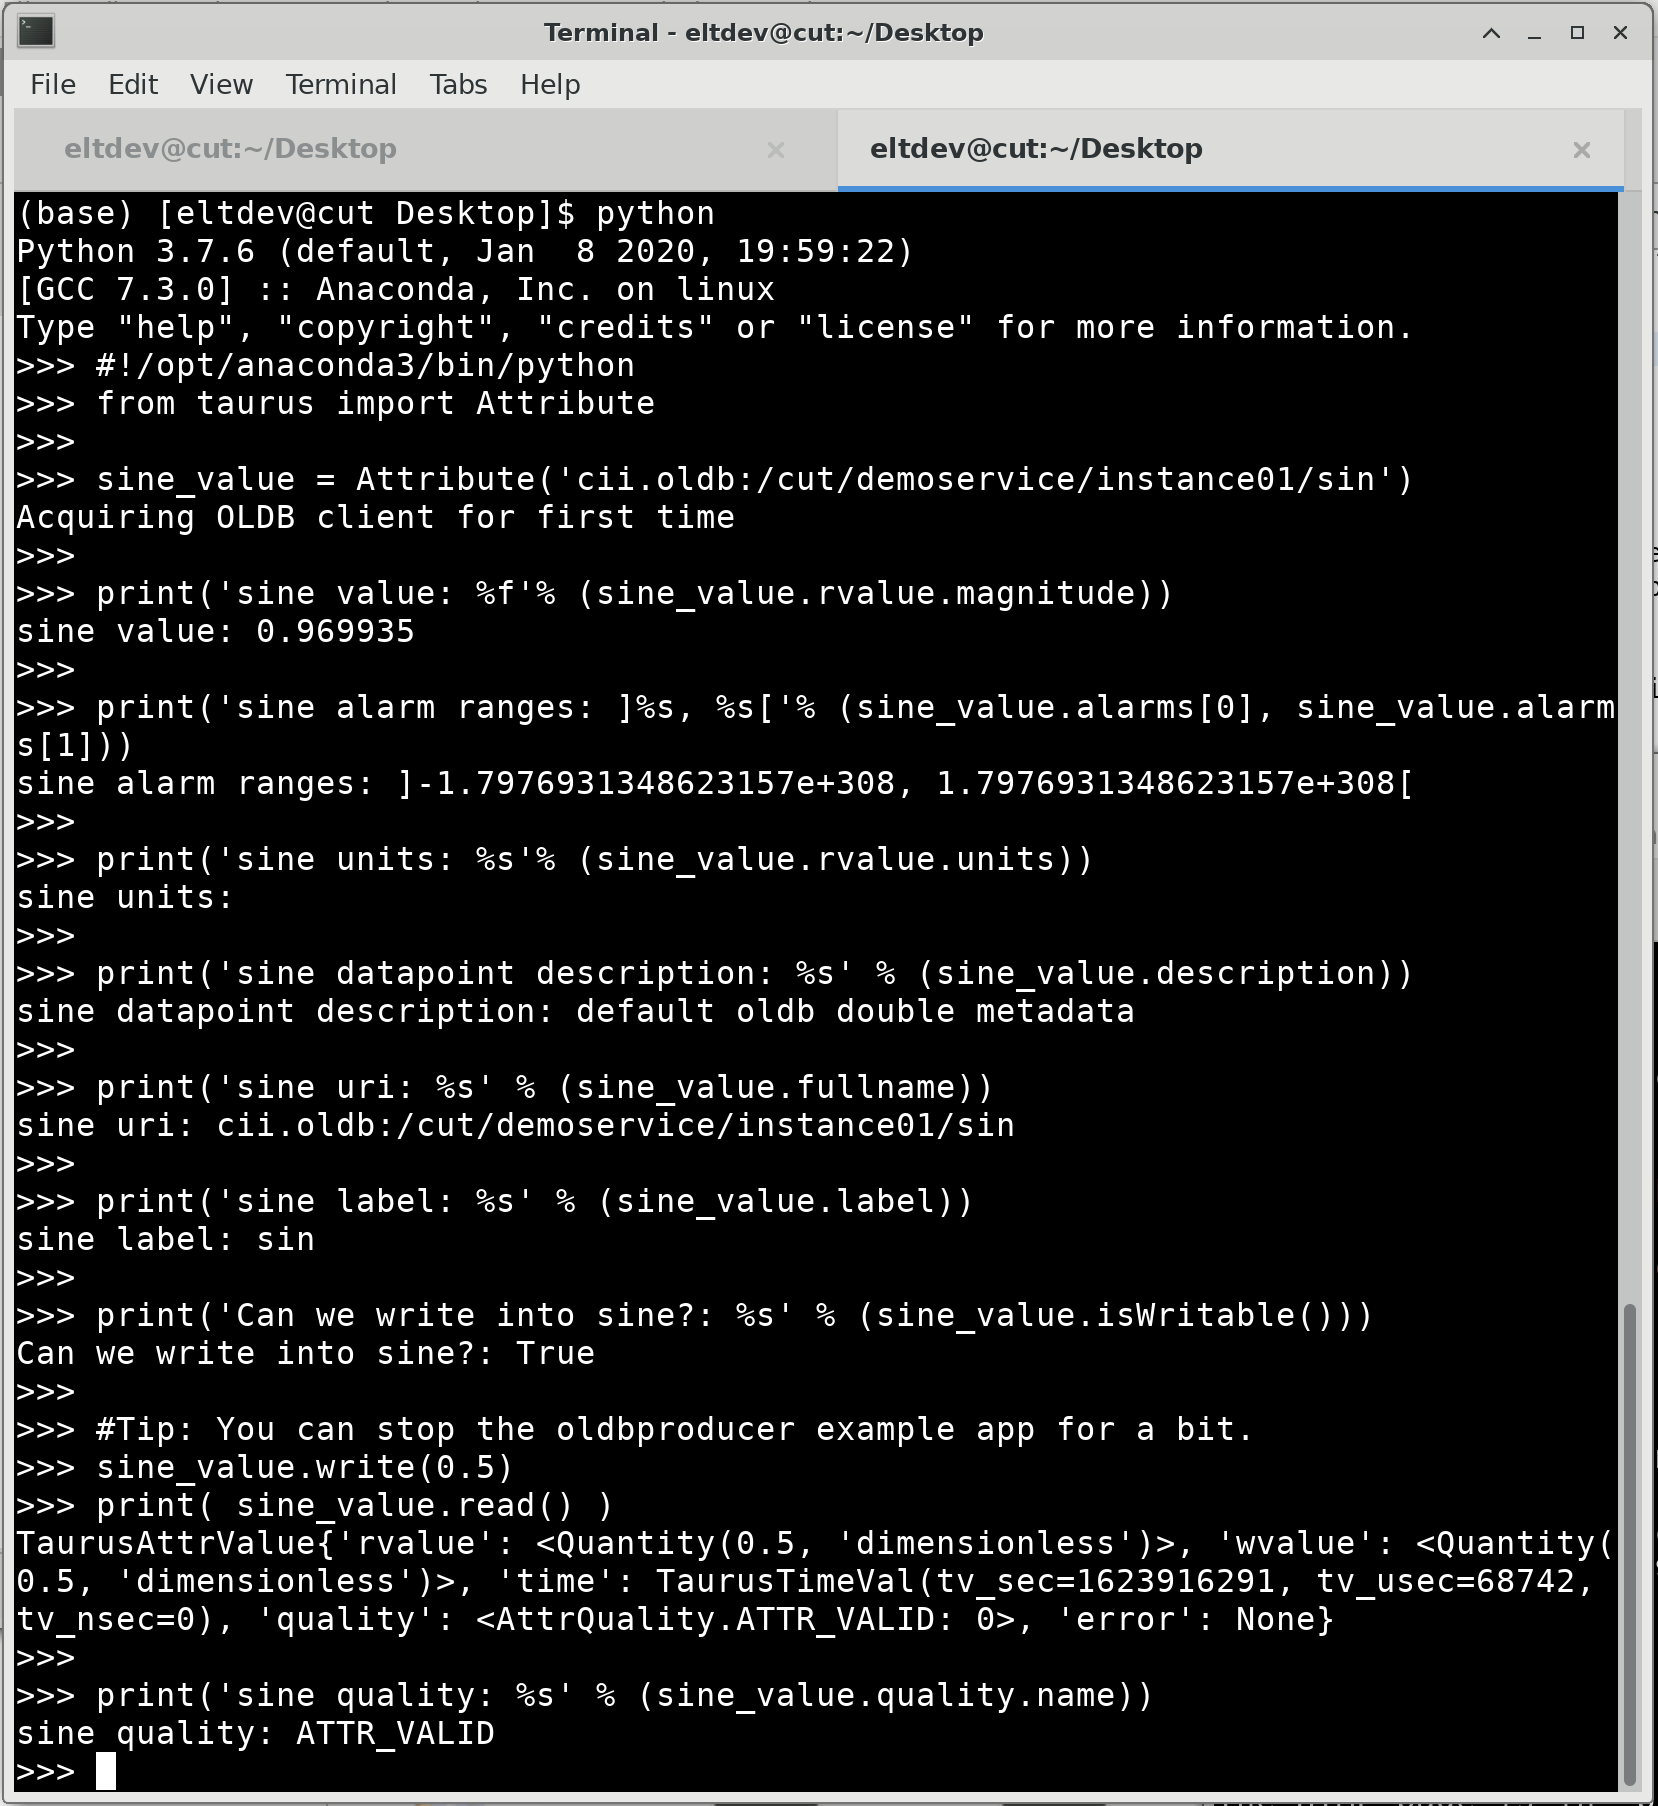
Terminal output of the script above.
6.4. TaurusLabel
Taking the examples from the first section, we now replace a few widgets by Taurus ones. These widgets automatically connect to a datapoint defined in their model property.
Taurus does not replace Qt, but provides a library called taurus.external.qt that abstract the developer from the particular set of python bindings used (PySide2, PyQt4, PyQt5). You can still use PySide2 libraries.
1 2 3 4 5 6 7 8 9 10 11 12 13 14 15 16 17 18 19 | #!/opt/anaconda3/bin/python
import sys
from taurus.external.qt import Qt
from taurus.qt.qtgui.application import TaurusApplication
app = TaurusApplication(sys.argv, cmd_line_parser=None,)
panel = Qt.QWidget()
layout = Qt.QHBoxLayout()
panel.setLayout(layout)
from taurus.qt.qtgui.display import TaurusLabel
w1, w2 = TaurusLabel(panel), TaurusLabel(panel)
layout.addWidget(w1)
layout.addWidget(w2)
w1.model = 'cii.oldb:/cut/demoservice/instance1/double-scalar-add'
w2.model = 'cii.oldb:/cut/demoservice/instance1/string-scalar-timestamp'
panel.show()
sys.exit(app.exec_())
|
A couple of details of this example:
TaurusLabel(panel)passes to the __init__ the panel object. Every widget should have a parent, this is used by Qt to correctly destroy the objects when windows are closed or the application is shutdown.The notation
w1, w2 = TaurusLabel(panel), TaurusLabel(panel)is permitted in Python, where return values are assigned in order.TaurusApplication class is a replacement for QApplication. It initializes Taurus logging capabilities, parses command line options, among other tasks.
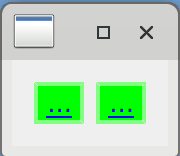
|
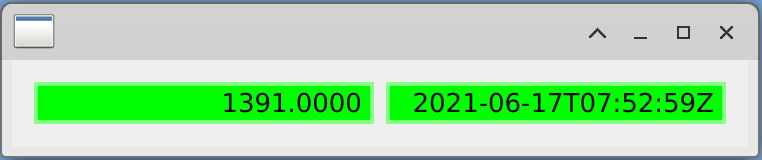
|
On the left, the example has just started. Once resized, it looks like the figure on the right. The first widget presents a number that increases over time. The second one presents a string that contains an ISO formatted timestamp. The values are the ones stored in the OLDB, and its background color represents the quality of that particular datapoint.
6.4.1. TaurusLabels and Fragments
In the next example, we explore a bit the fragments of an attribute.
1 2 3 4 5 6 7 8 9 10 11 12 13 14 15 16 17 18 19 | #!/opt/anaconda3/bin/python
import sys
from taurus.external.qt import Qt
from taurus.qt.qtgui.application import TaurusApplication
from taurus.qt.qtgui.display import TaurusLabel
app = TaurusApplication(sys.argv, cmd_line_parser=None,)
panel = Qt.QWidget()
layout = Qt.QVBoxLayout()
panel.setLayout(layout)
w1, w2 = TaurusLabel(), TaurusLabel()
layout.addWidget(w1)
layout.addWidget(w2)
w1.model, w1.bgRole = 'cii.oldb:/cut/demoservice/instance1/double-scalar-sin#label', ''
w2.model, w2.bgRole = 'cii.oldb:/cut/demoservice/instance1/double-scalar-sin', ''
panel.show()
sys.exit(app.exec_())
|
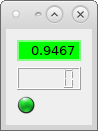
The example depicts the TaurusLabel with a bright background. The background is used automatically by the TaurusLabel to represent the quality of the Attribute. In this example, we are modifying the bgRole property of a widget to remove any role to be shown. This makes the widget to look more like a QLabel, which sometimes is desirable.
Aside from unsetting the bgRoles properties, the w1 TaurusLabel uses a fragment. #label in the URI indicates that instead of the value, we are interested in displaying the label, or short name of the Attribute.
Also, the example uses a Vertical Layout, instead of an Horizontal one.
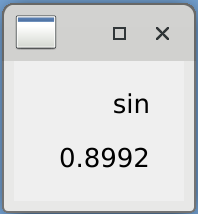
TaurusLabel example
6.5. TaurusForm
Taurus offers a way to abstract yourself from all the programming of these widgets, by using the Taurus form. This utility is a CLI command (taurus form), and also a class (TaurusForm) allows to quickly bring up a UI with the specified _widgets_ in it.
(base) [eeltdev@eltdev showcase]$ taurus form --help
Usage: taurus form [OPTIONS] [MODELS]...

  Shows a Taurus form populated with the given model names

Options:
  --window-name TEXT  Name of the window
  --config FILENAME   configuration file for initialization
  --help              Show this message and exit.
The command line version of TaurusForm takes a string list as model, and creates a QGridLayout of 5 columns by n rows, n being the number of items in the string list.
Label |
Read Widget |
Write Widget |
Units |
Extra |
For example:
taurus form 'eval:Q("12.5m")' 'cii.oldb:/cut/demoservice/instance1/string-scalar-timestamp'
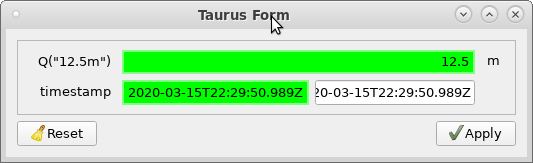
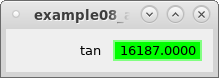
Taurus Form allows to quickly access values, using a list of strings.
In this case, the first row has the eval:Q("12.5m") Attribute, which has a Label, Read Widget and Units entries. The second row has the cii.oldb:/cut/demoservice/instance1/string-scalar-timestamp which has a Label, Read Widget and Write Widget. Note that none of them has the Extra widget, as is feature intended for manual configuration.

Taurus Form highlighting in blue items that have been updated.
The Reset button will restore the value in the Write widgets to the last know value read from the backend. The Apply button will send the values in the Write widget to the backend for store. When the value from the Write widget is different from the one in the backend, then the widget turns blue, and the label is highlighted in blue as well.
Another interesting feature of the TaurusForm, is that is allows to change the Read and Write widgets on runtime. Right clicking on the label allows to access this, and other kind of functions.
If you have two Taurus Form windows opened, or two of them in the same application, you can drag and drop model items from one to another.
Here is how to use TaurusForm in code:
1 2 3 4 5 6 7 8 9 10 11 12 13 14 15 16 17 18 19 20 21 22 | #!/opt/anaconda3/bin/python
import sys
from taurus.external.qt import Qt
from taurus.qt.qtgui.application import TaurusApplication
from taurus.qt.qtgui.panel import TaurusForm
app = TaurusApplication(sys.argv, cmd_line_parser=None,)
panel = TaurusForm()
props = [ 'double-scalar-sin', 'double-scalar-cos', 'string-scalar-timestamp',
'double-scalar-add', 'int-scalar-add', 'double-vector-rand' ]
model = [ 'cii.oldb:/cut/demoservice/instance1/%s' % p for p in props ]
# This is the same as:
# model = [ 'cii.oldb:/cut/demoservice/instance01/double-scalar-sin',
# 'cii.oldb:/cut/demoservice/instance01/double-scalar-cos',
# 'cii.oldb:/cut/demoservice/instance01/string-scalar-timestamp',
# 'cii.oldb:/cut/demoservice/instance01/double-scalar-add',
# 'cii.oldb:/cut/demoservice/instance01/int-scalar-add',
# 'cii.oldb:/cut/demoservice/instance01/double-vector-rand']
panel.setModel(model)
panel.show()
sys.exit(app.exec_())
|
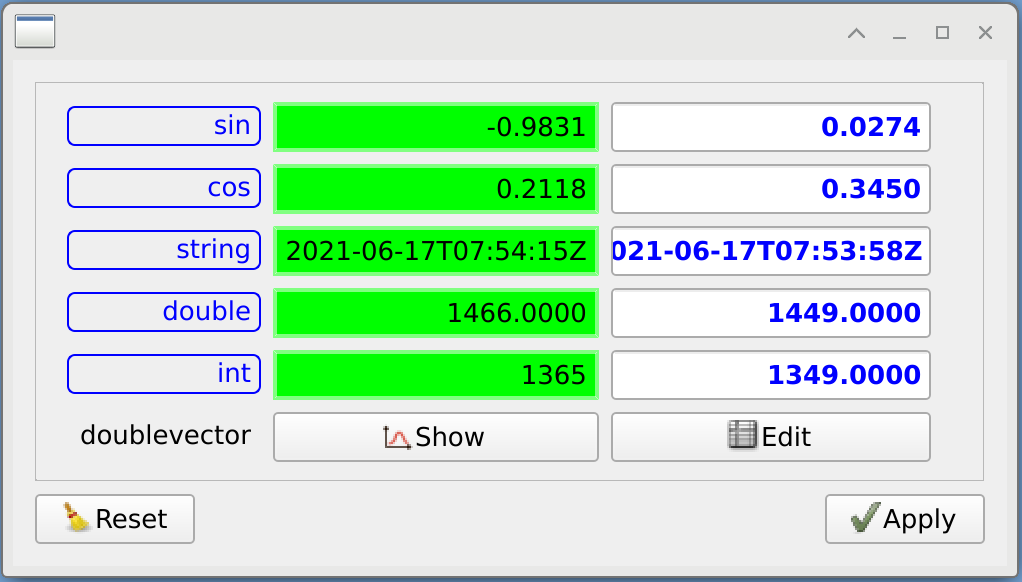
TaurusForm example
Tip
Nowhere in the command line or the code, the developer indicates which kind of widget we want to use for each item in the model. This is automatically determined by the Taurus Form, according to the datatype, and this can be altered by the use of CustomMappings.
Tip
At this point, the developer may notice a pattern. The URI is used to auto-determine the kind of Model element we need. The datatype and roles are used to automatically determine the widgets we need.
If using code, the developer may want to force the use of specific widgets. This can be achieved like this:
1 2 3 4 5 6 7 8 9 10 11 12 13 14 15 16 17 18 19 20 | #!/opt/anaconda3/bin/python
import sys
from taurus.external.qt import Qt
from taurus.qt.qtgui.application import TaurusApplication
from taurus.qt.qtgui.panel import TaurusForm
from taurus.qt.qtgui.display import TaurusLabel
from taurus.qt.qtgui.plot import TaurusTrend
from taurus.qt.qtgui.plot import TaurusPlot
app = TaurusApplication(sys.argv, cmd_line_parser=None,)
panel = TaurusForm()
props = [ 'double-scalar-sin', 'double-scalar-cos', 'double-scalar-add',
'int-scalar-add', 'double-vector-rand' ]
model = [ 'cii.oldb:/cut/demoservice/instance1/%s' % p for p in props ]
panel.setModel(model)
panel[1].readWidgetClass = 'TaurusTrend'
panel[4].readWidgetClass = 'TaurusPlot'
panel.show()
sys.exit(app.exec_())
|
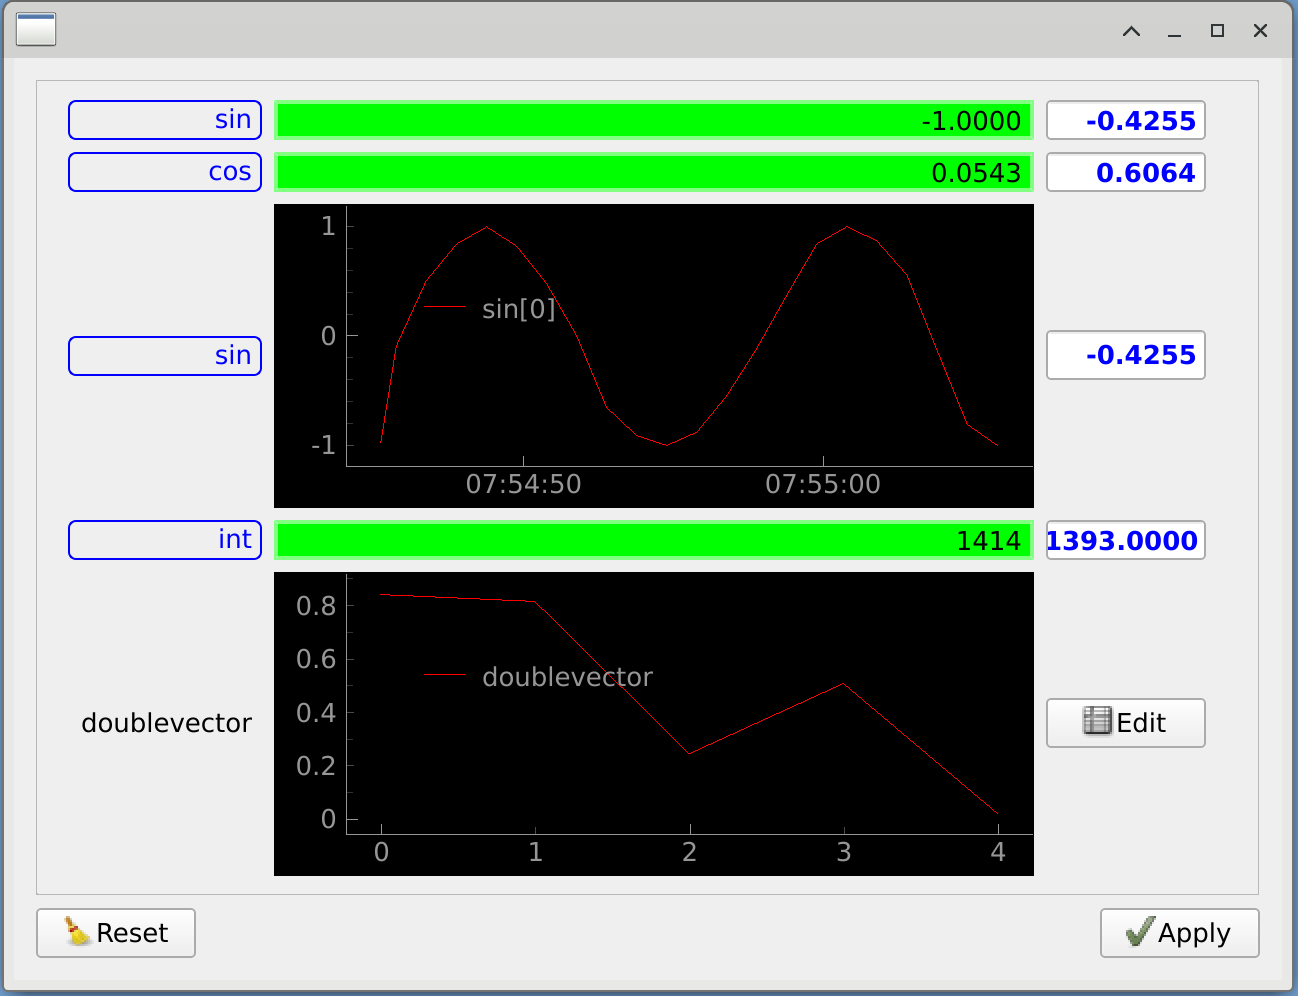
TaurusForm example, forcing specific widgets
This examples is very similar to the previous one. The main difference is that we access the third and fifth elements of the panel object, and change its readWidgetClass. Notice that in one we used a string with the class name, and in another, the class reference.
6.6. TaurusPlot and TaurusTrend
This examples shows how to use the TaurusTrend widget, using the model to set three URI. A developer may set a single entry, or multiple ones, as needed.
1 2 3 4 5 6 7 8 9 10 11 12 13 14 15 16 | #!/opt/anaconda3/bin/python
import sys
from taurus.external.qt import Qt
from taurus.qt.qtgui.application import TaurusApplication
from taurus.qt.qtgui.plot import TaurusTrend
app = TaurusApplication(sys.argv, cmd_line_parser=None,)
panel = TaurusTrend()
model = ['cii.oldb:/cut/demoservice/instance1/double-scalar-sin',
'cii.oldb:/cut/demoservice/instance1/double-scalar-cos',
'cii.oldb:/cut/demoservice/instance1/double-scalar-tan']
panel.setModel(model)
panel.setYRange(-1.0, 1.0)
panel.show()
sys.exit(app.exec_())
|
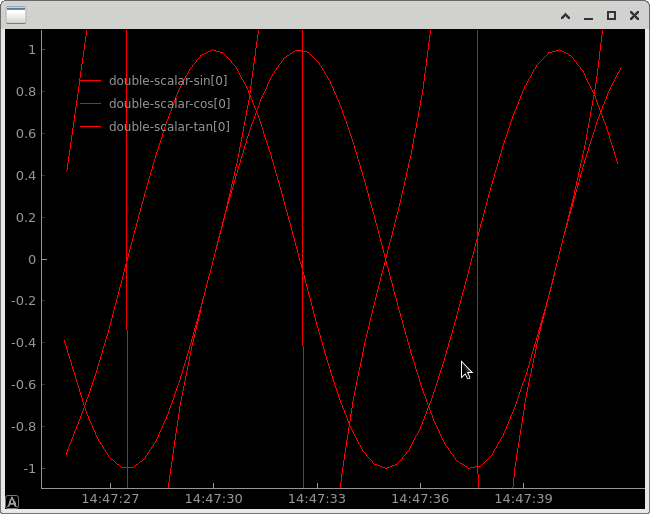
TaurusTrend example
The example below three vectors generated by the cut-demo-service. Each vector is a 100 points
representation of sin, cos, tan functions..
1 2 3 4 5 6 7 8 9 10 11 12 13 14 15 16 | #!/opt/anaconda3/bin/python
import sys
from taurus.external.qt import Qt
from taurus.qt.qtgui.application import TaurusApplication
from taurus.qt.qtgui.plot import TaurusPlot
app = TaurusApplication(sys.argv, cmd_line_parser=None,)
panel = TaurusPlot()
model = ['cii.oldb:/cut/demoservice/instance1/double-vector-sin',
'cii.oldb:/cut/demoservice/instance1/double-vector-cos',
'cii.oldb:/cut/demoservice/instance1/double-vector-tan']
panel.setModel(model)
panel.setYRange(-1.0, 1.0)
panel.show()
sys.exit(app.exec_())
|
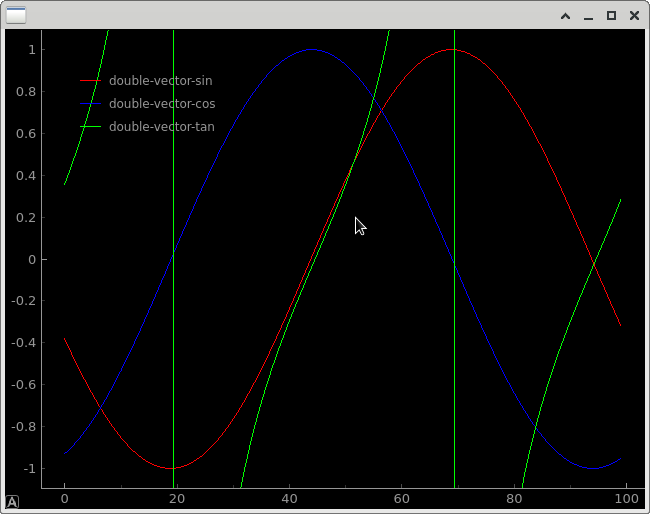
TaurusPlot example
6.7. TaurusLauncherButton
In this example, a new Widget is introduced: the TaurusLauncherButton. Even though it can store a model property, it is not used by this widget. Instead, when pressed, it will execute show() on the widget it has a reference to, and set the model to that widget.
Tip
It has some other cosmetic customizations. It is important to note the use of Qt.QIcon.fromTheme method. This is a Class method that indicates Qt to search for an icon with that name.
These names are standard (FreeDesktop Icon Naming), and its locations are also standard. Using these icon naming convention and non-direct access to icons is very important for ergonomics requirements. When the theme is changed, the icons are automatically changed as well.
1 2 3 4 5 6 7 8 9 10 11 12 13 14 15 16 | #!/opt/anaconda3/bin/python
import sys
from taurus.external.qt import Qt
from taurus.qt.qtgui.application import TaurusApplication
from taurus.qt.qtgui.button import TaurusLauncherButton
from taurus.qt.qtgui.display import TaurusLabel
app = TaurusApplication(sys.argv, cmd_line_parser=None,)
button = TaurusLauncherButton(
text='View timestamp',
widget=TaurusLabel(),
icon=Qt.QIcon.fromTheme('window-new')
)
button.setModel('cii.oldb:/cut/demoservice/instance1/string-scalar-timestamp')
button.show()
sys.exit(app.exec_())
|
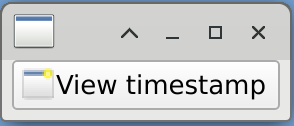
|

|
TaurusLauncherButton: On the left, the example has just started. On the right, the user has clicked on the button.
You can also use it to open TaurusForms. Please notice the notation on the model.
1 2 3 4 5 6 7 8 9 10 11 12 13 14 15 16 | #!/opt/anaconda3/bin/python
import sys
from taurus.external.qt import Qt
from taurus.qt.qtgui.application import TaurusApplication
from taurus.qt.qtgui.button import TaurusLauncherButton
from taurus.qt.qtgui.panel import TaurusForm
app = TaurusApplication(sys.argv, cmd_line_parser=None,)
button = TaurusLauncherButton(
text='Open Demoservice',
widget=TaurusForm(),
icon=Qt.QIcon.fromTheme('window-new')
)
button.setModel('cii.oldb:/cut/demoservice/instance1/double-scalar-sin,cii.oldb:/cut/demoservice/instance1/double-scalar-cos,cii.oldb:/cut/demoservice/instance1/int-scalar-add,cii.oldb:/cut/demoservice/instance1/double-scalar-add,cii.oldb:/cut/demoservice/instance1/string-scalar-timestamp,cii.oldb:/cut/demoservice/instance1/double-vector-sin')
button.show()
sys.exit(app.exec_())
|
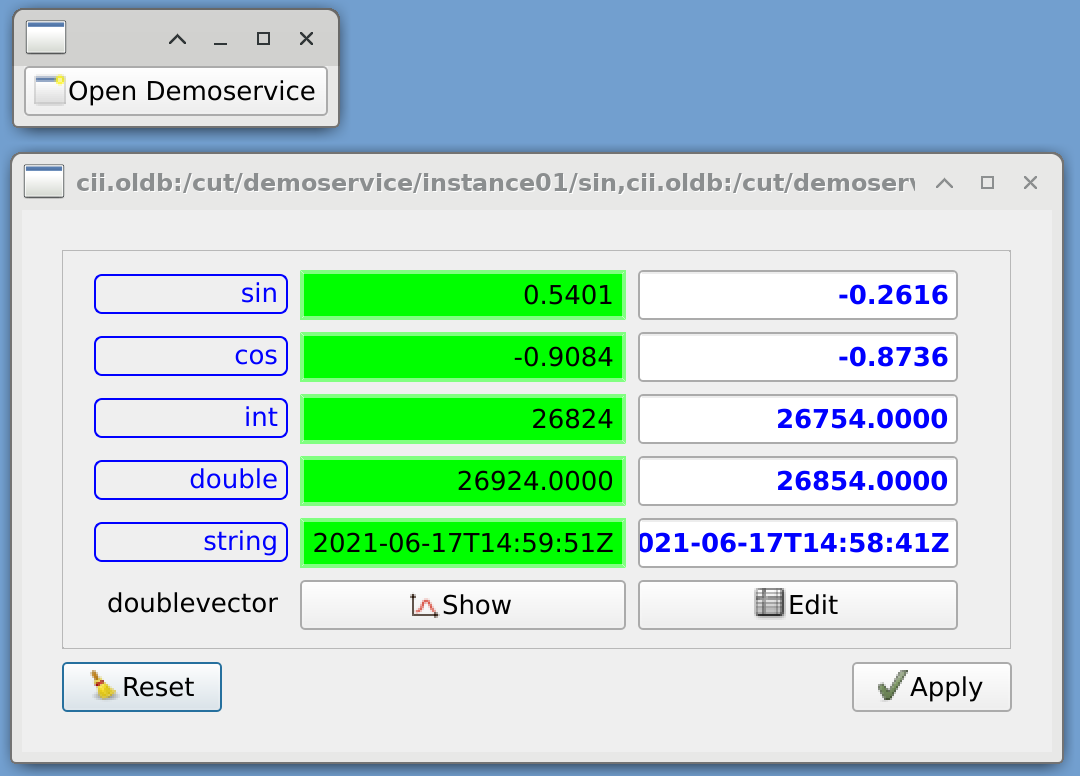
TaurusLauncherButton opening a TaurusForm
6.8. Taurus Capabilities
Taurus is a UI Framework, intended for Control Systems. It provides access to its functionality through Python code, but also through a command line tool: This command line tool is meant as a utility, not for final products.
6.8.1. Evaluation Model
The evaluation plugin can instruct Taurus to execute basic python code instructions:
1 2 3 4 5 6 7 8 9 10 11 | #!/opt/anaconda3/bin/python
from taurus import Attribute
rand1 = Attribute('eval:rand()')
rand1.rvalue
angles = Attribute('eval:Q(12,"rad")')
angles.rvalue
sum = Attribute('eval:{eval:Q(12,"rad")}+{eval:Q(24,"rad")}')
sum.rvalue
strsplt = Attribute('eval:{eval:"2021-10-12T11:45:00.012"}.split("T")')
strsplt.rvalue
|
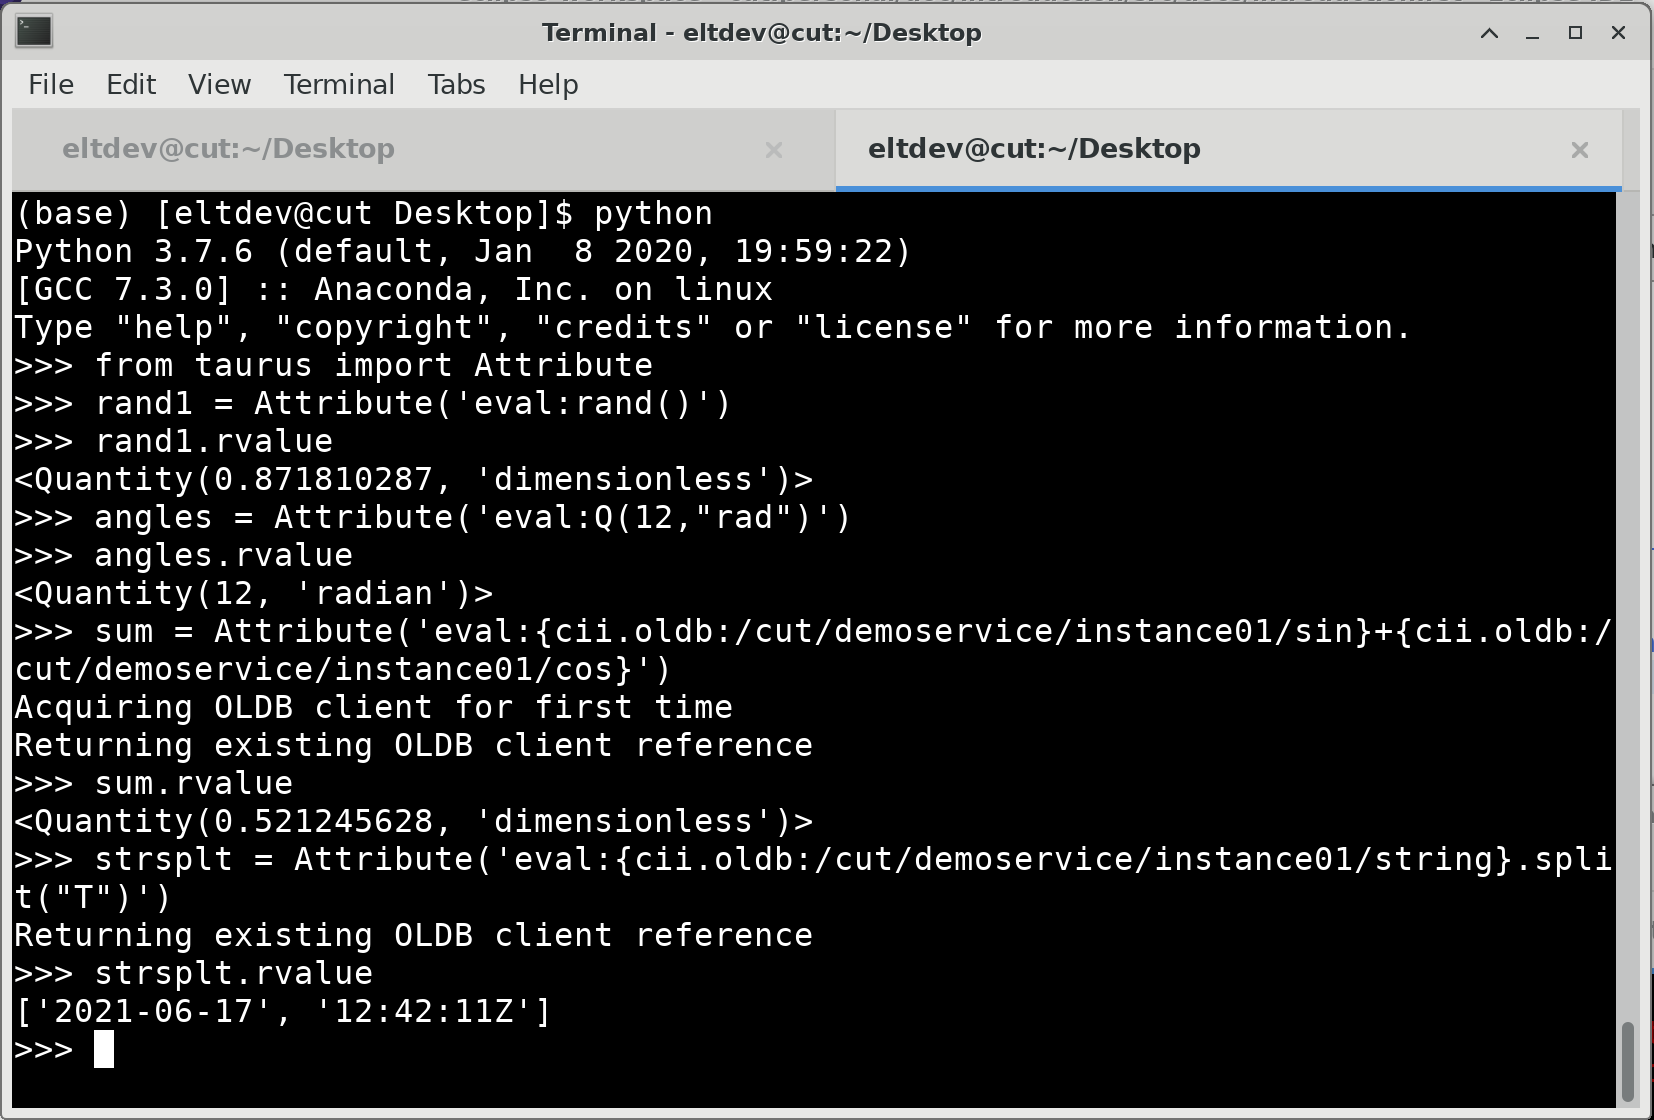
Evaluation Plugin examples, through code
A few examples using command line tool taurus.
1 2 3 4 5 6 | #!/bin/bash
taurus form 'eval:rand(12)' \
'eval:2*{'cii.oldb:/cut/demoservice/instance1/int-scalar-add'}' \
'eval:rand(16,16)' \
'eval:@os.*/path.exists("/etc/motd")'
|
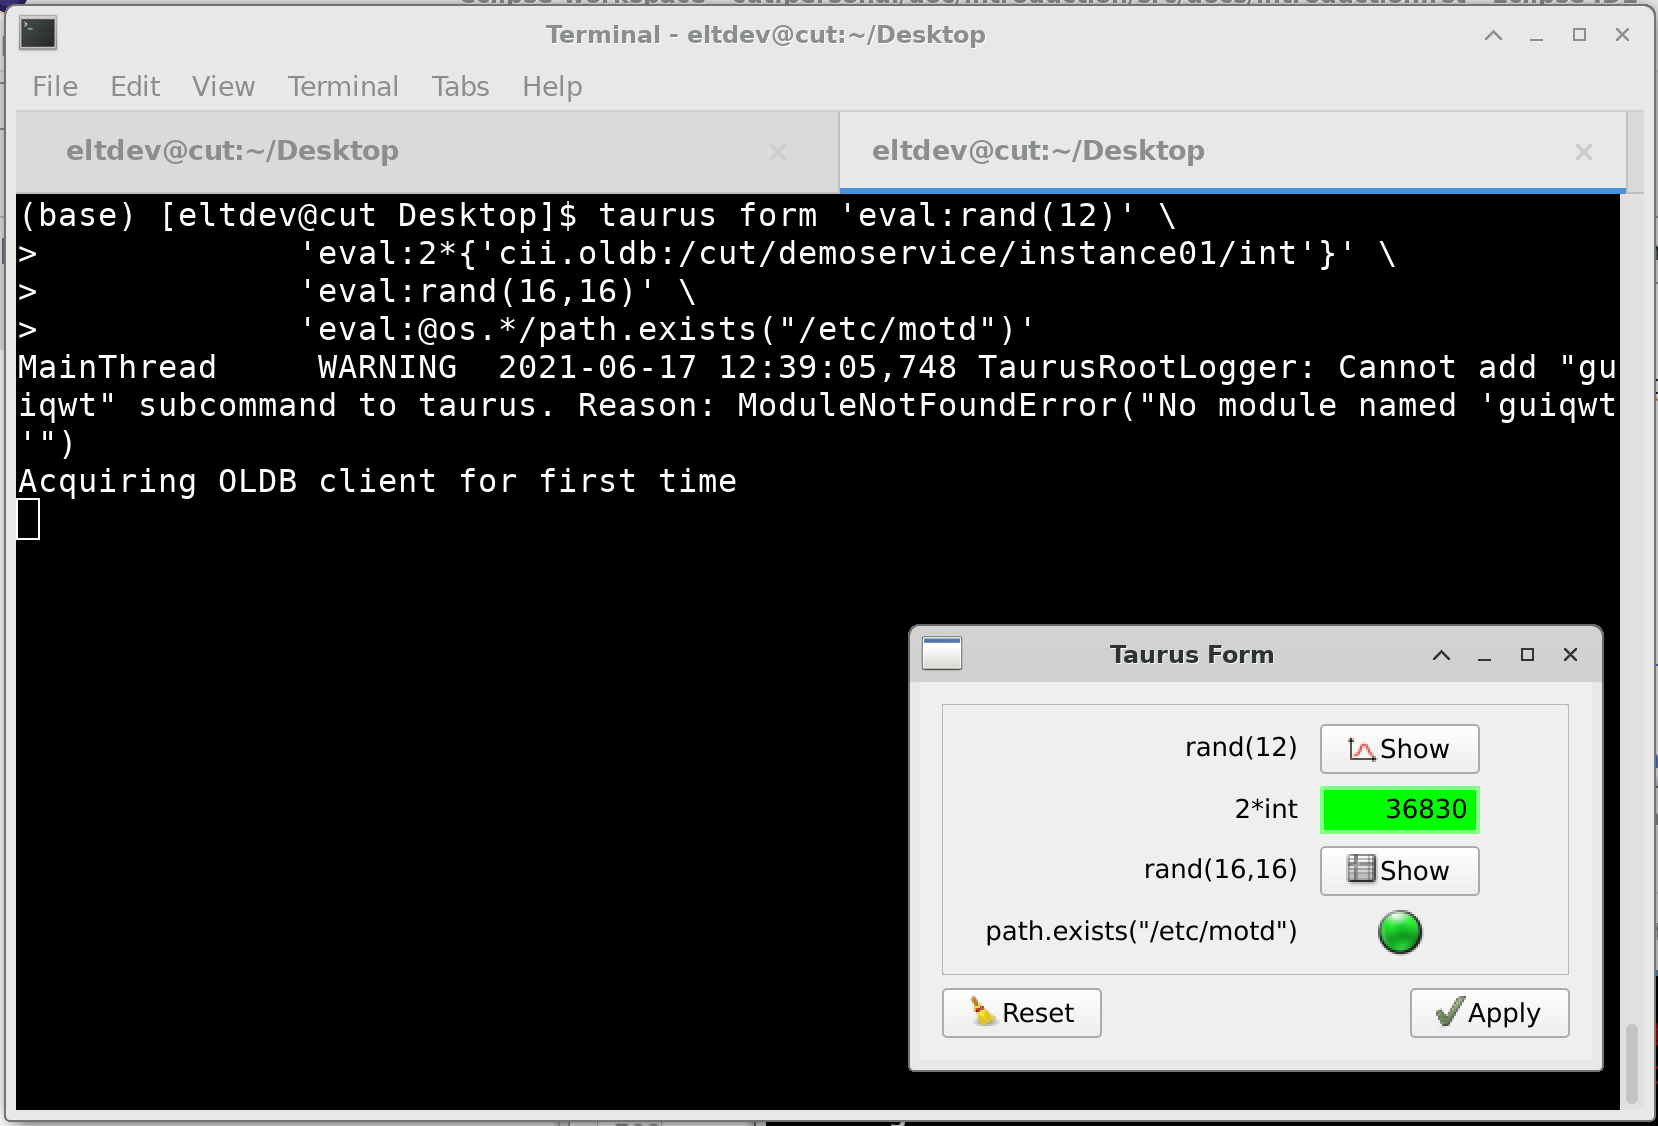
Evaluation Plugin examples, through command line
6.8.2. Command Line Tool
Every functionality in taurus can be accessed through the taurus command line interface.
To see the complete syntax of taurus command line:
taurus --help
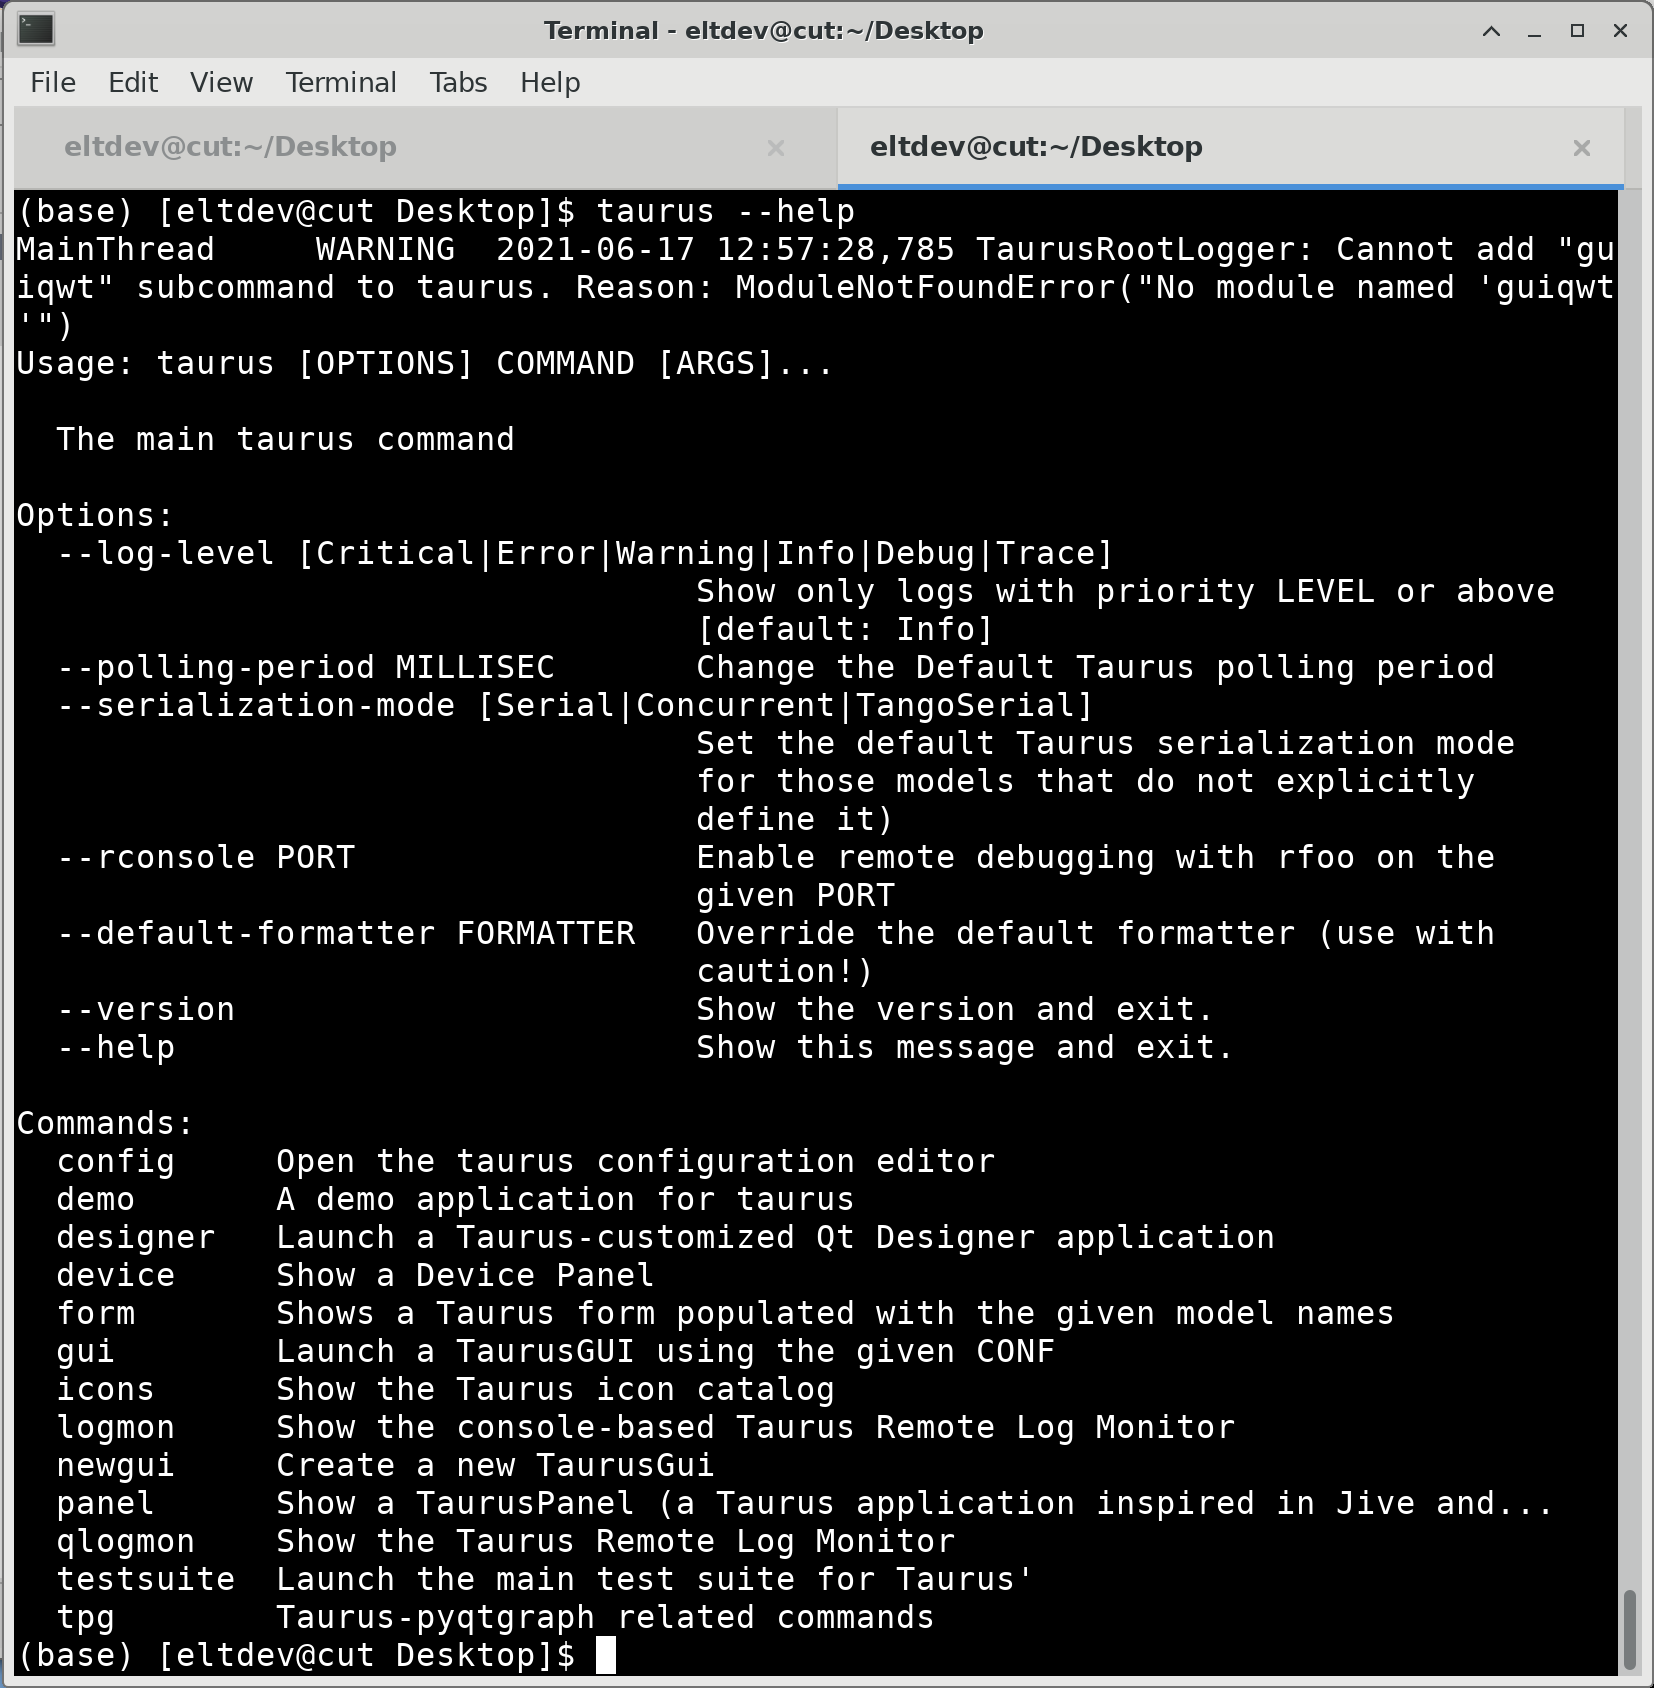
Taurus command line help
To quickly create a Taurus Form that immediately shows the contents of two datapoints:
taurus form 'cii.oldb:/cut/demoservice/instance1/double-scalar-sin' 'cii.oldb:/cut/demoservice/instance1/double-scalar-cos'
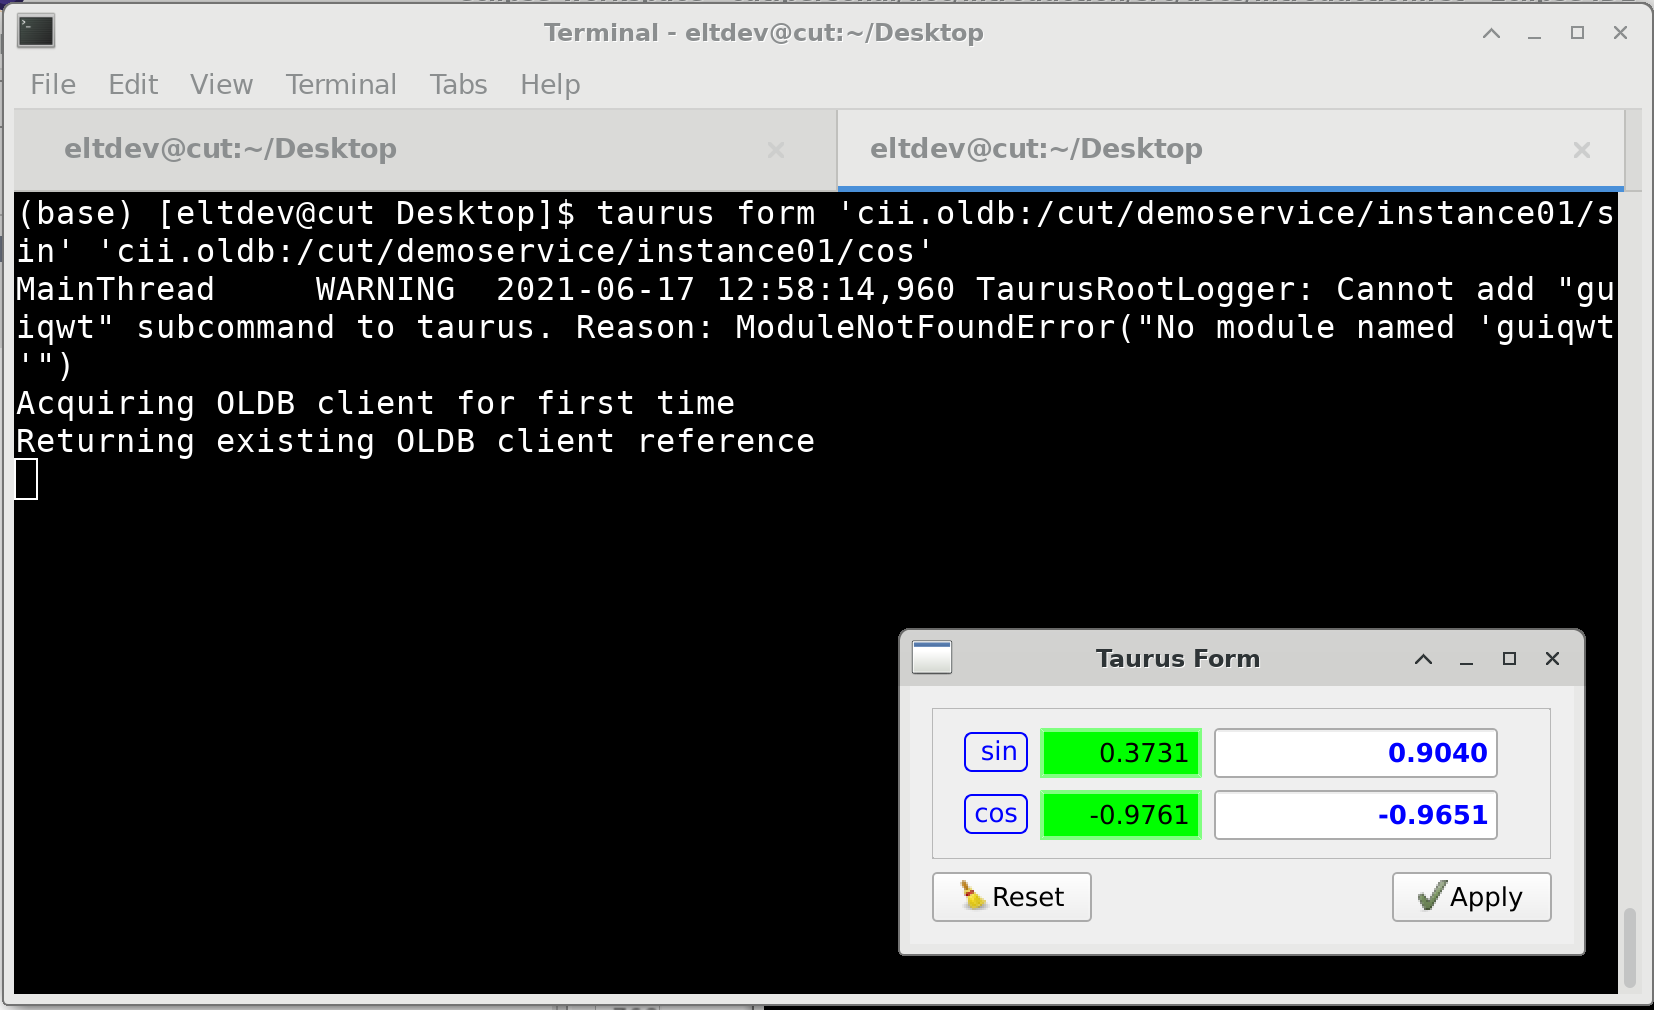
Requesting two attributes to Taurus Form command line interface
To execute taurus, with trace level logs:
taurus --log-level Trace form 'cii.oldb:/cut/demoservice/instance1/double-scalar-sin' 'cii.oldb:/cut/demoservice/instance1/double-scalar-cos'

Taurus command line with trace level logs enabled
6.9. Qt and UI Files
The final step of this introduction, is to be able to create UI file, and understand how these files are used.
In order to do so, we will use Qt Designer. You can start it using a terminal:
designer
Once opened, the designer will ask us what kind of UI we want to create through the New Form Dialog. On the list of templates from the left, choose Widget. On the lower part of the New Form Dialog, click on the Create Button.
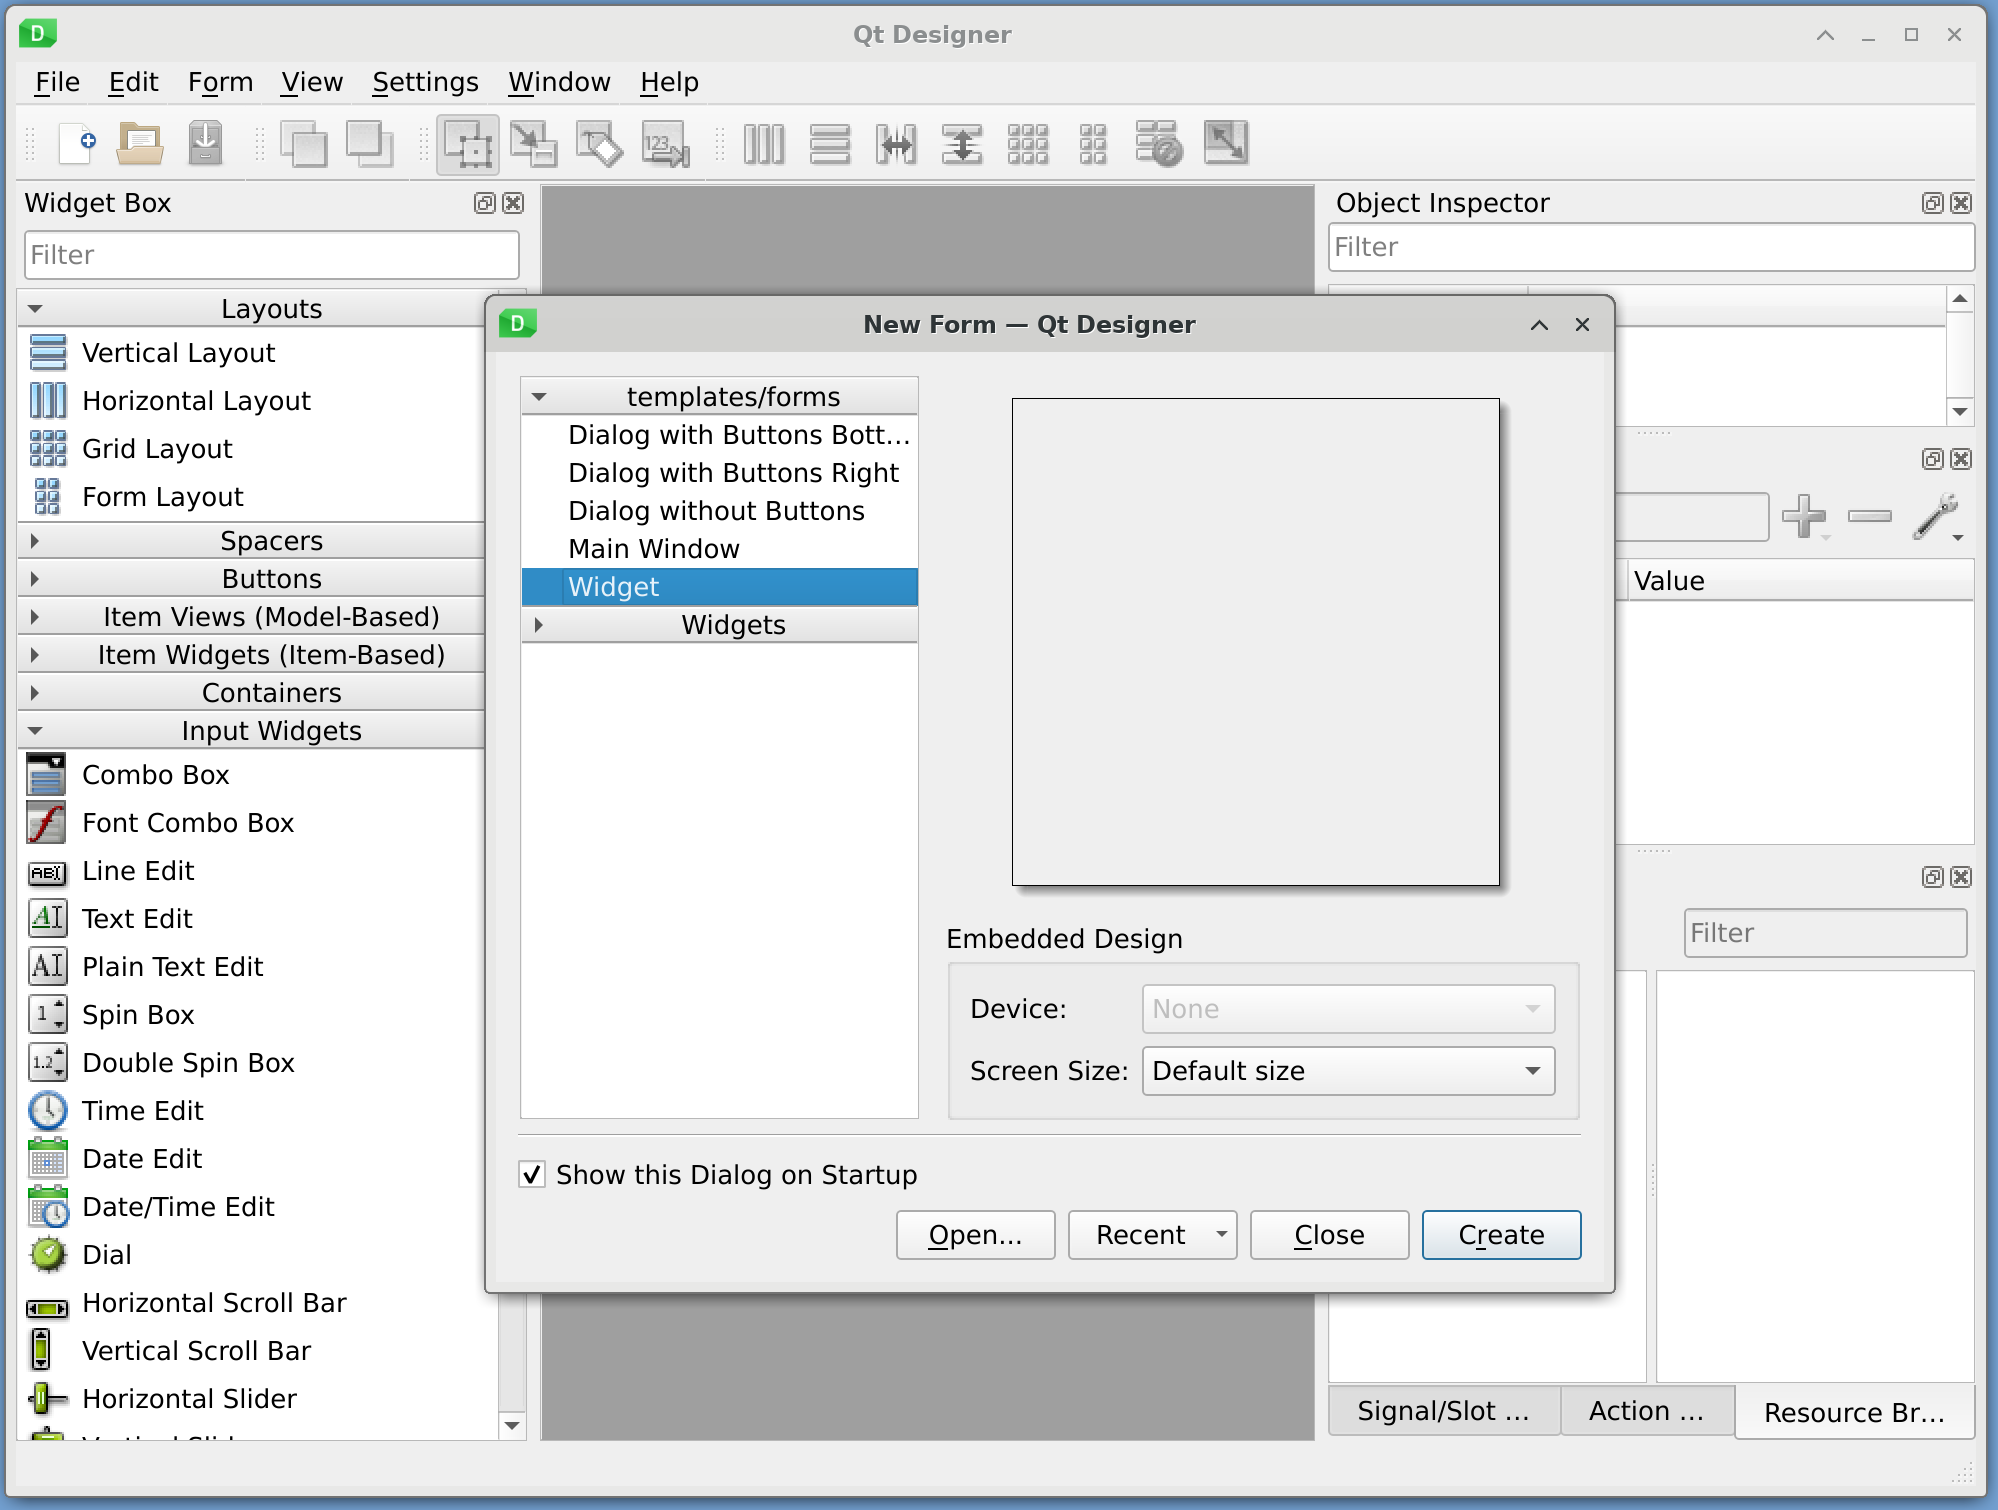
Qt Designer - New Form Dialog
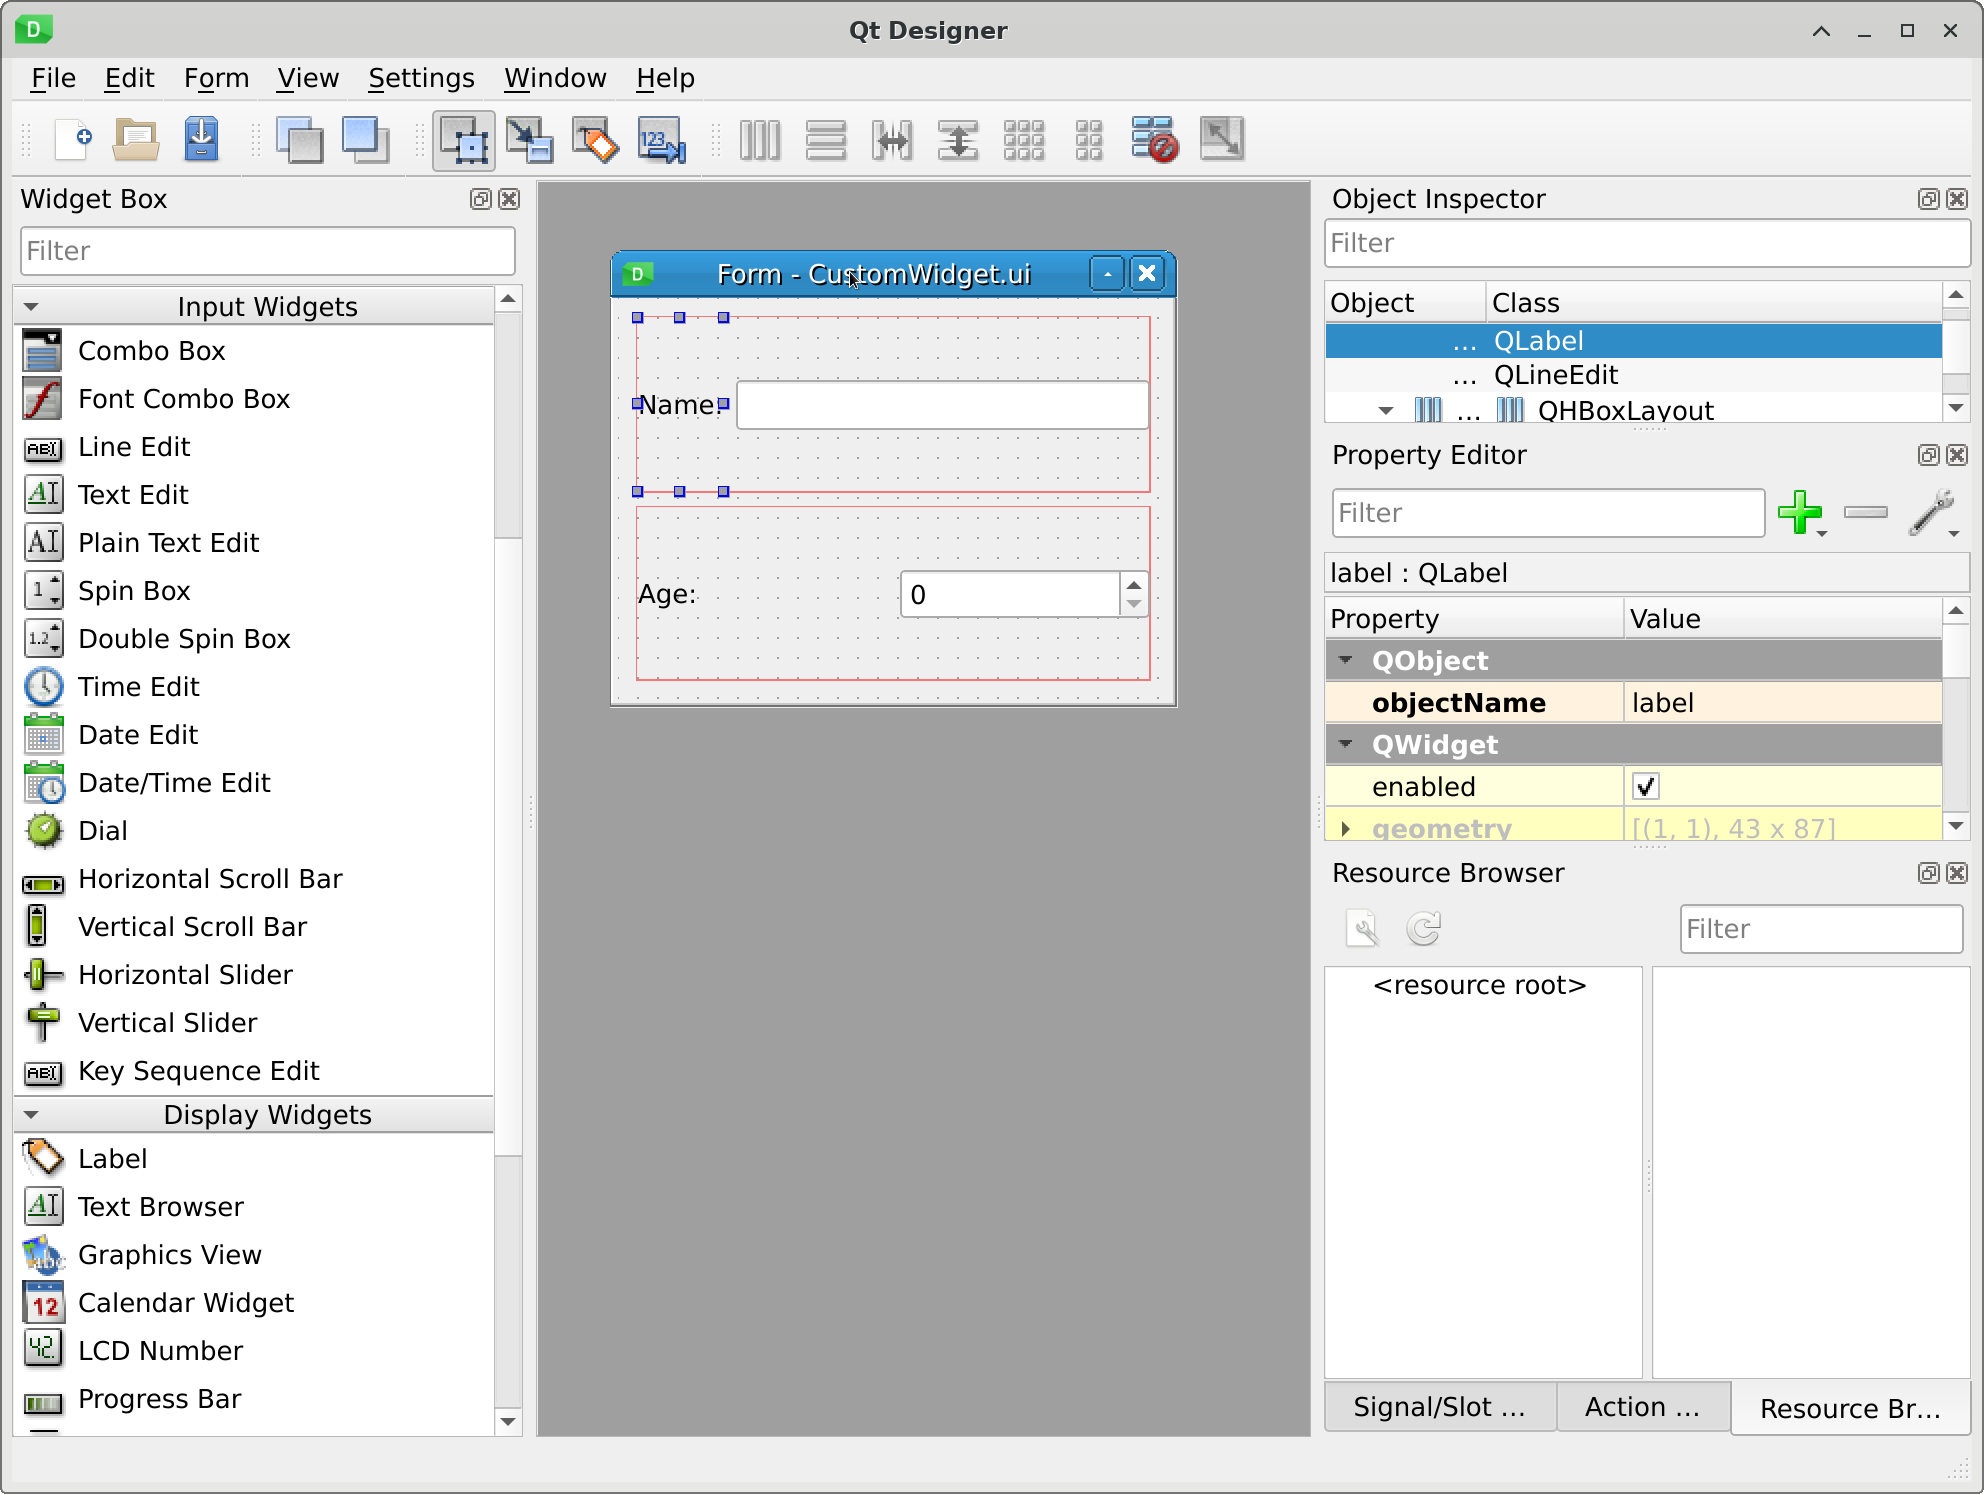
The Designer has three main sections:
On the left, a Widget Box Docking Window.
On the center, a grey are where the documents we are editing are located.
On the right side, several Docking Windows, the most importants are the Object Inspector, and the Property Editor.
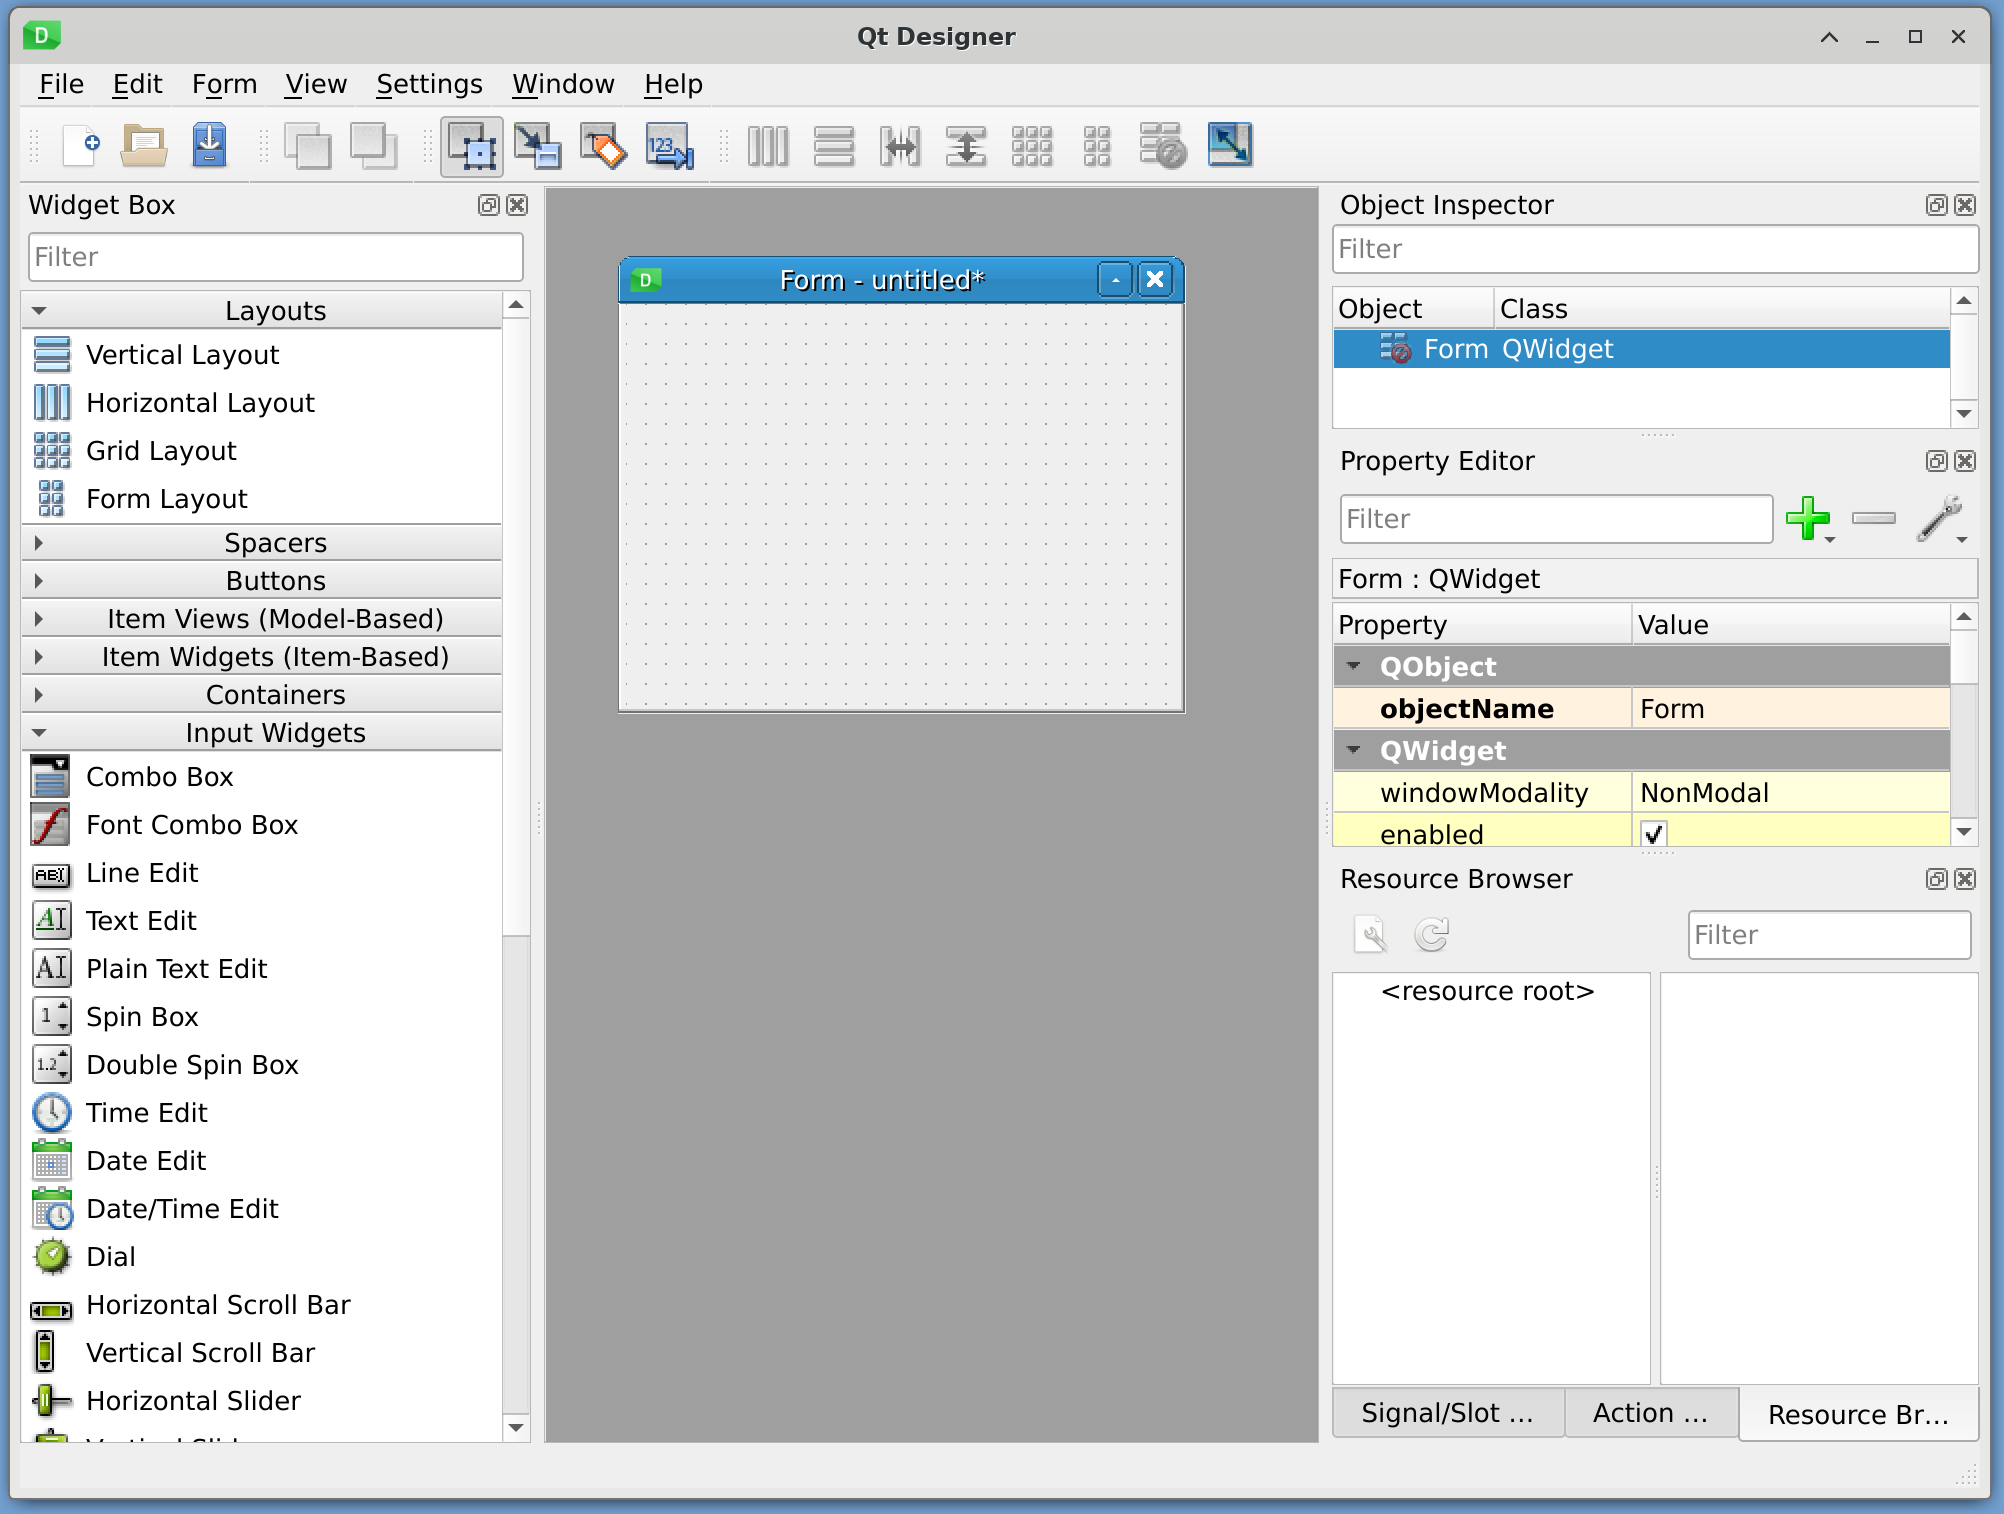
Qt Designer - Main View
From the Widget Box Docking Window, we will drag the widgets and elements we need into the UI. Special characteristics of these widgets can be edited in the Property Editor Docking Window.
We will start by changing the name of the widget. In the Property Editor Docking Window, look for the row Object Name. Change it to “CustomWidget”.
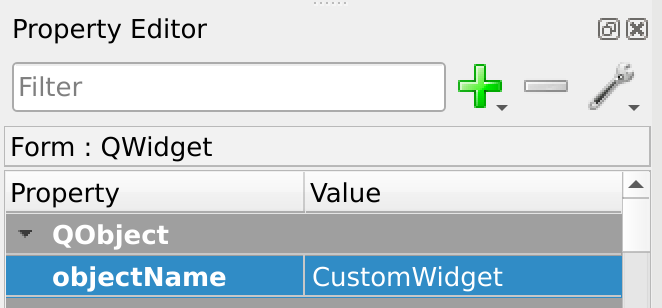
Qt Designer - Property Editor
Now look in the Widget Box Docking Window for the Horizontal Layout. Drag and drop this element into the UI, in the upper section, and then repeat, dropping it in the lower section.

Qt Designer - Two Horizontal Layouts
Next, look in the Widget Box Docking Window for the Label Widget. Drag and drop this widget inside of the upper horizontal layout. When you finish dropping it, it should be contained by the Layout. Repeart for the lower horizontal layout.
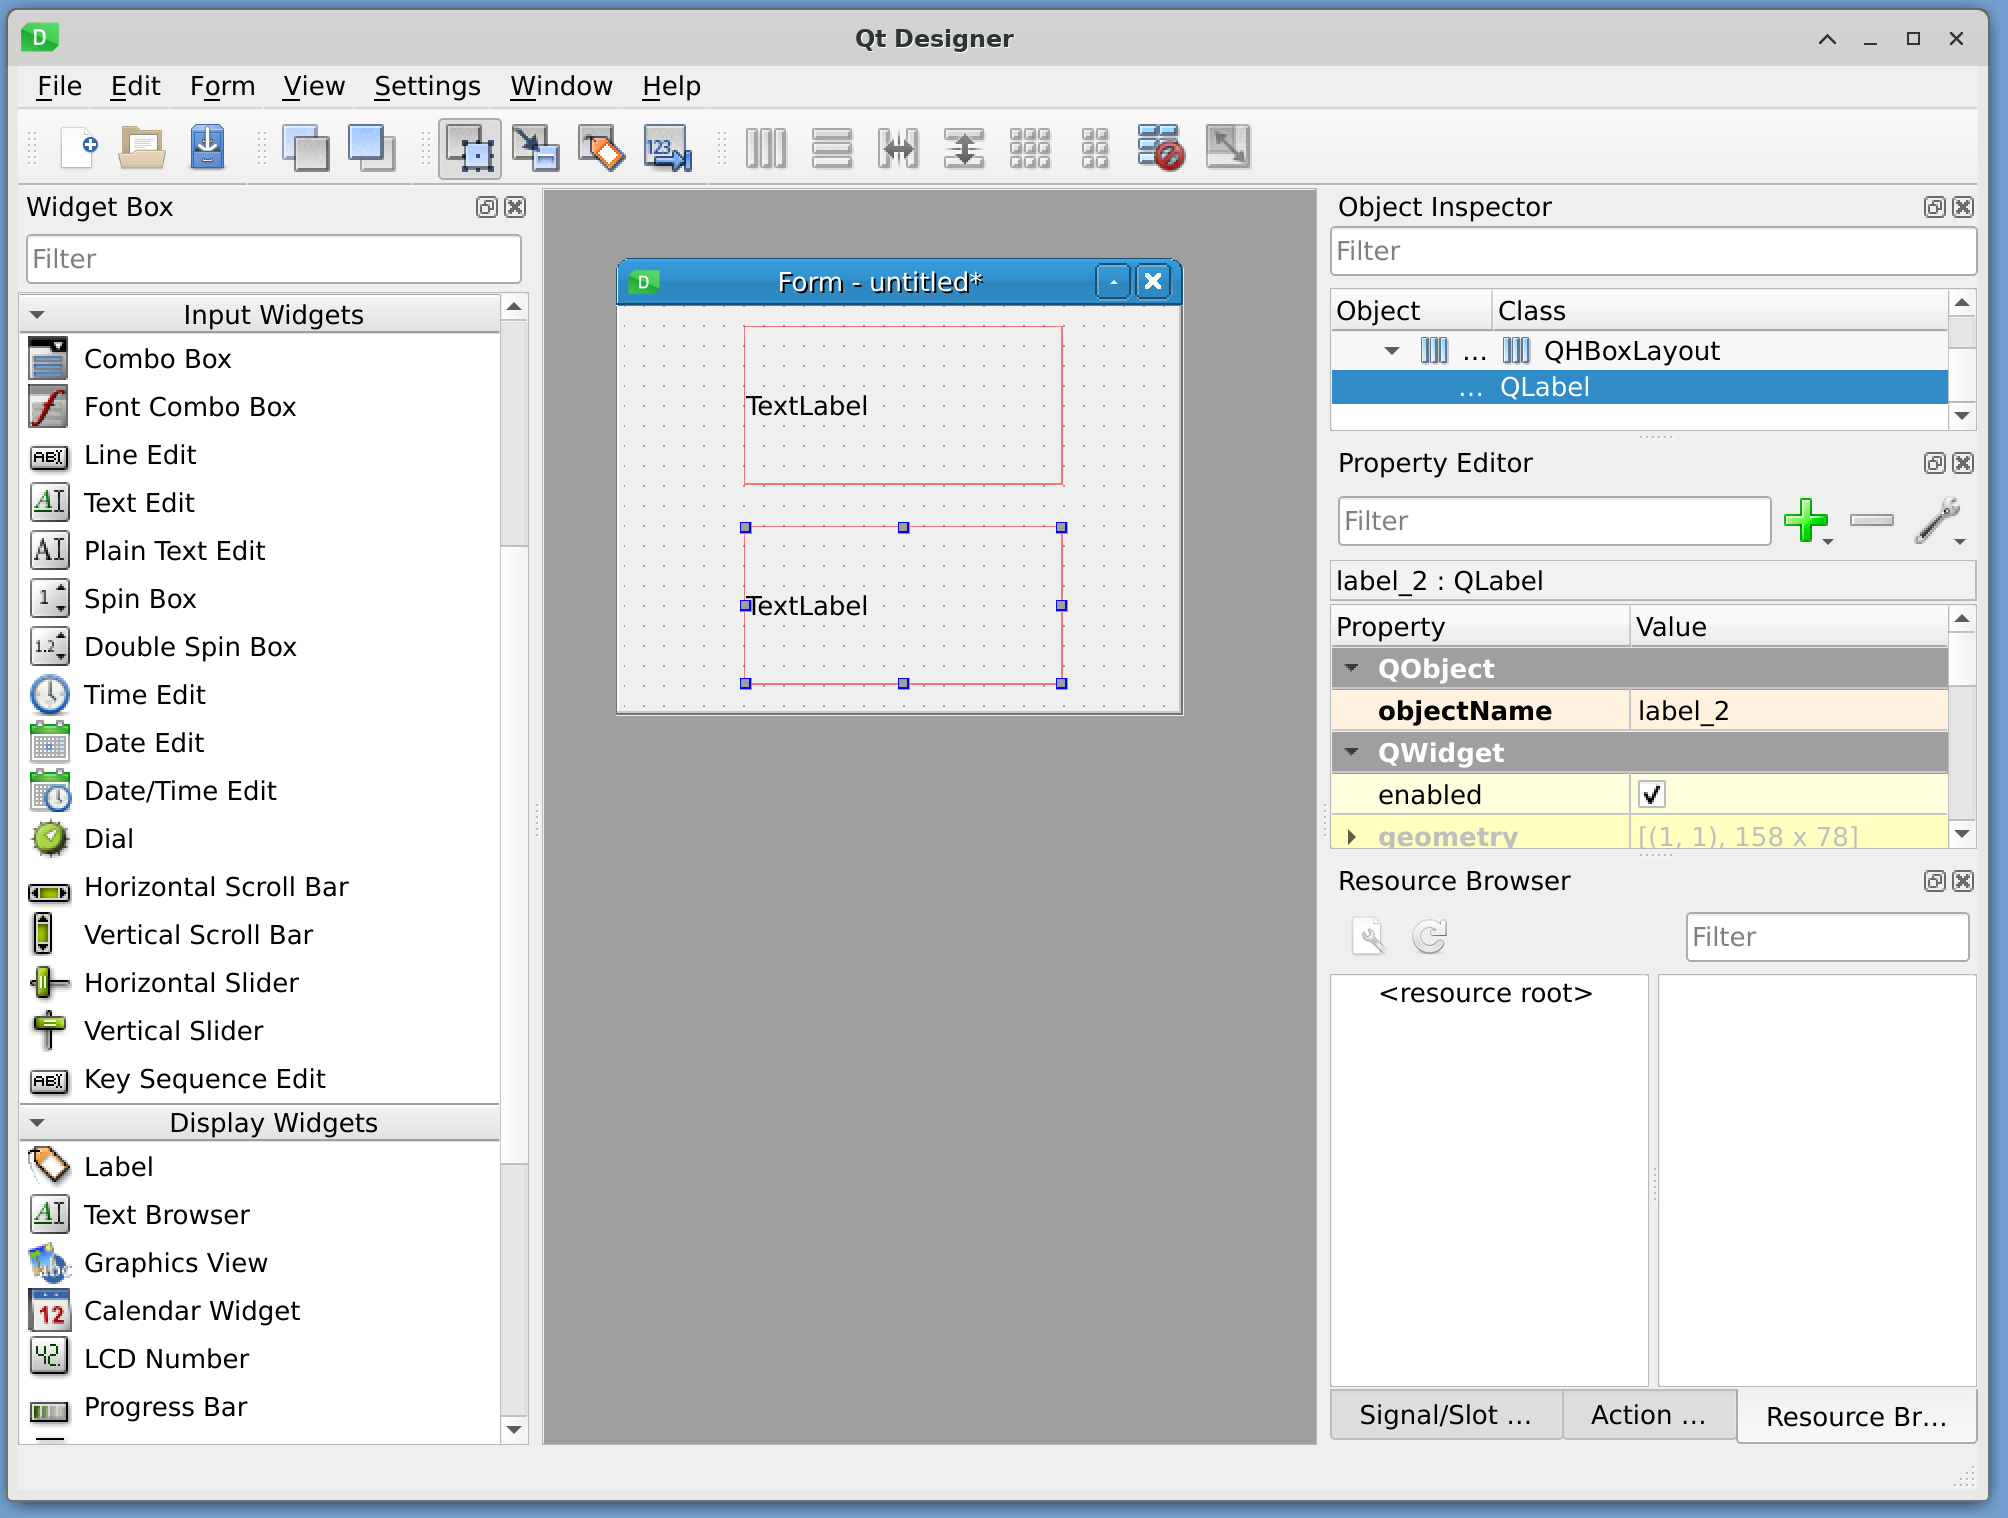
Qt Designer - Two Labels
In our following step, we are looking in the Widget Box Docking Window for the Line Edit Widget. Drag but do not drop the widget yet. Move the mouse over the upper layout. See that a blue appears where it will be positioned. If the blue line is on the right side of the Label, then drop the widget.
We will repeat the same maneuver, but instead with a Spin Box Widget, and dropping in into the lower horizontal layout.
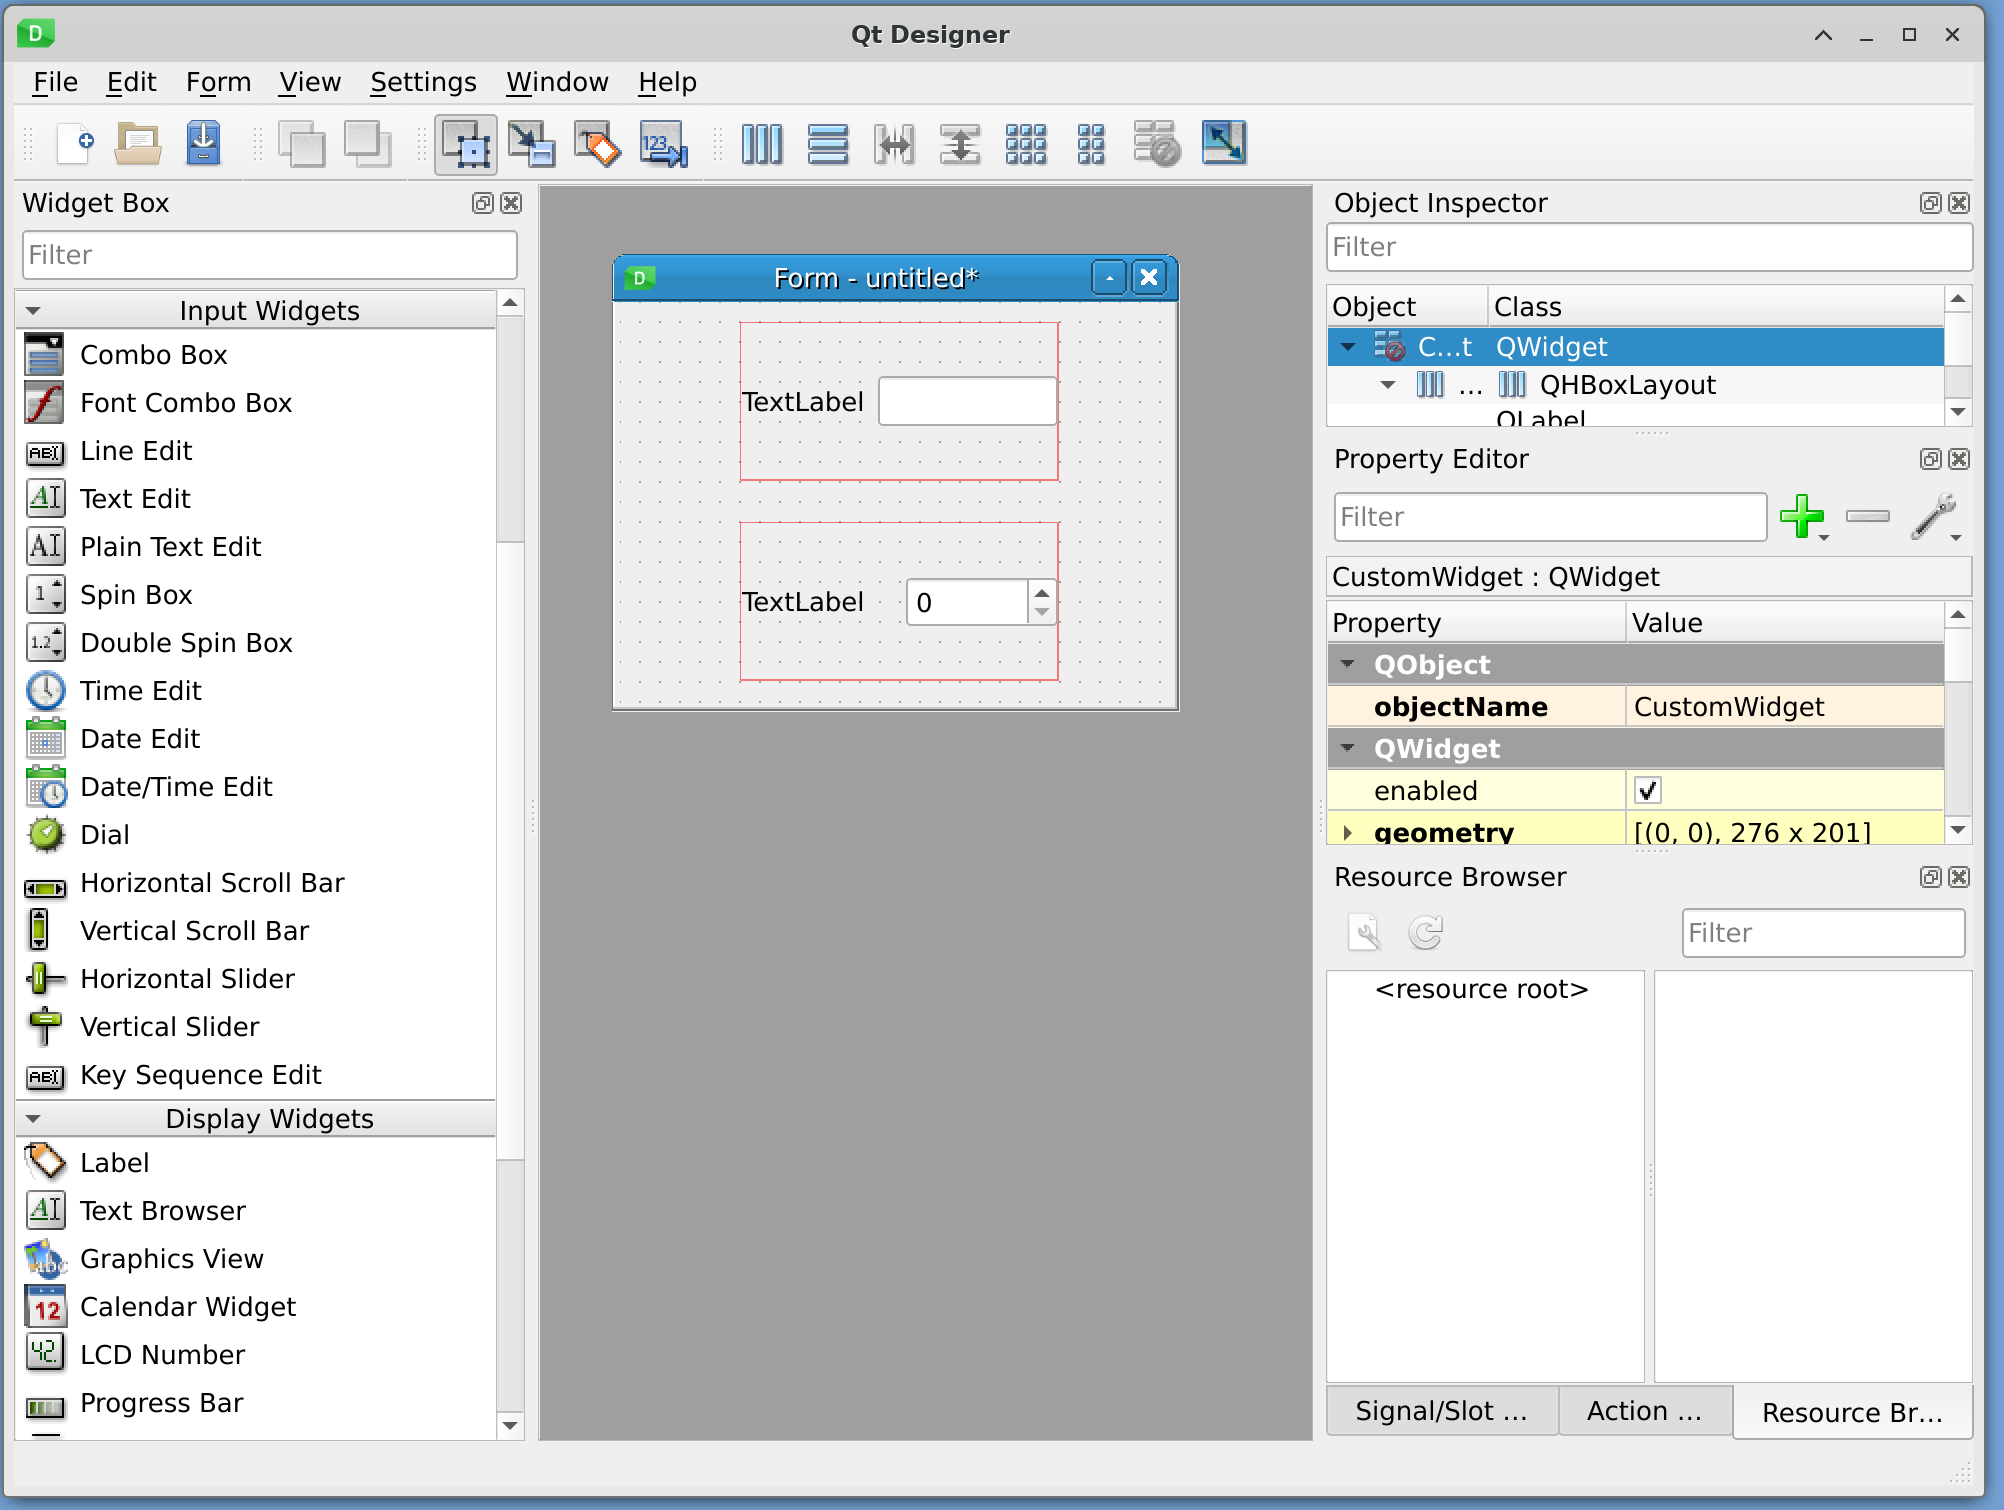
Qt Designer - Two Input Widgets: Line Edit and Spin Box
Now we will set up the main layout of the CustomWidget. Right click on an empty space on the widget. Navigate to Entry and click it.

Qt Designer - CustomWidget layout.
This will make our entire UI responsive to resize events. (and scaling).
Finally we will double click on the first Label Widget and with that, we can change the “text” property of the widget. Enter “Name:”.
Do the same for the lower Label Widget, but enter “Age:”.
Qt Designer - Text properties on Labels.
Save this file as CustomWidget.ui
In order to use this file, we need to generate the code from it. This CustomWidget.ui file is a XML representation of the UI above. To generate python code from it, execute:
pyside2-uic CustomWidget.ui > Ui_CustomWidget.py
And finally, we need to create the python application that will use this new python code, and render the UI for us. See the code below for it.
1 2 3 4 5 6 7 8 9 10 11 12 13 14 15 16 17 18 19 | #!/opt/anaconda3/bin/python
import sys
from taurus.external.qt import Qt
from taurus.qt.qtgui.application import TaurusApplication
from Ui_CustomWidget import Ui_CustomWidget
class CustomWidget(Qt.QWidget):
def __init__(self, parent=None):
Qt.QWidget.__init__(self, parent)
self.ui = Ui_CustomWidget()
self.ui.setupUi(self)
if __name__ == "__main__":
app = TaurusApplication(sys.argv)
widget = CustomWidget()
widget.show()
sys.exit(app.exec_())
|
The main difference from the example we have seen sofar is the inclusion of a new class. This class inherits from QWidget, the same one we have use to create our UI. This is very important: The type of top-level widget we use in the UI file must match the Class we inherit from.
The class only has defined the __init__ method for it. In it, we initialize its only parent (python requires explicit initialization of parents), then the create a new object from the class that is provided to us from the pyside2-uic execution.
Finally, we call a method from that class, setupUi(self). This method will create the UI for us, as if we had programmed it ourselves. All the UI elements will be available a self.ui attribute.
And with that, the widget is ready to be used. We proceed as usual, with the show() and app.exec_() methods, to show and enter the event engine.

Qt Designer - CustomWidget running.
6.10. Widgets
All Taurus widget inherit from the same base class, the TaurusBaseWidget. This class inherits at some point from BaseConfigurableClass and Logger.
BaseConfigurableClass is in charge of storing and persisting configuration of widgets. This is mostly used by the GUI builder, which uses this functionality to persist position and size of widgets, the models it should present and which roles, amont other things.
Logger uses python logging framework to process every log generated by the Taurus framework.
As an example, here is the inheritance tree of the TaurusLabel widget:
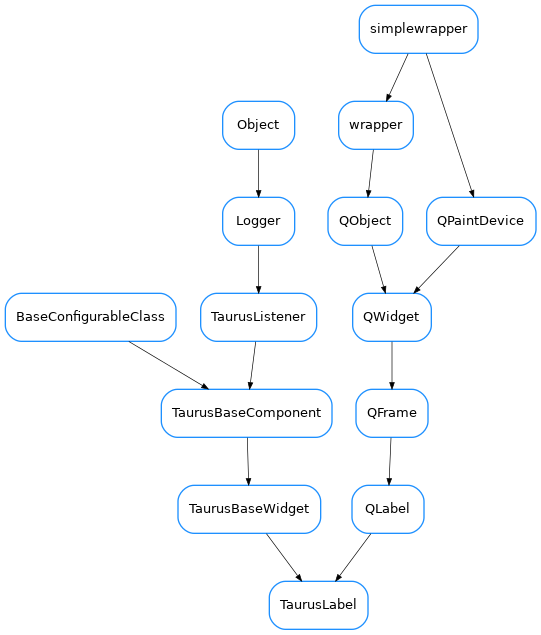
Taurus Label inheritance tree, from Taurus documentation.
6.10.1. Display Widgets
One main class of widgets that Taurus offers, is the display widgets. All of them are located in the taurus.qt.qtgui.display python module. All of them are read-only, as they are intended for the presentation of information.
Display widgets, from top to bottom: TaurusLabel, TaurusLCD and TaurusLed
In the same module, there are basic Qt widgets, that are then used by the Taurus widgets.
Taurus widgets do not implement logic, nor formatting. Taurus widgets only add three properties, and one method, which are used then by its Controller.
model a URI stored in a string. The widgets are not in charge of getting its model, only to contain the string.
fgRole indicates which piece of data from the model, will be used as text.
bgRole indicates which piece of data from the model will be used as background color.
handleEvent() used to inform widgets of Taurus events. They are mostly related to model changes. These events are forwarded to the controller.
An interesting concept of Taurus is the fragments. Fragments are properties in the model item that we can query. Fragments are accessed by a URI, prepending #fragname_name. For example, we can a short name (label) for the datapoint using
1 2 3 4 5 6 7 8 9 10 11 12 13 14 15 16 17 18 19 20 21 | #!/opt/anaconda3/bin/python
import sys
from taurus.external.qt import Qt
from taurus.qt.qtgui.application import TaurusApplication
from taurus.qt.qtgui.display import TaurusLabel
if __name__ == "__main__":
app = TaurusApplication(sys.argv, cmd_line_parser=None,)
panel = Qt.QWidget()
layout = Qt.QHBoxLayout()
panel.setLayout(layout)
w1, w2 = TaurusLabel(), TaurusLabel()
layout.addWidget(w1)
layout.addWidget(w2)
w1.model, w1.bgRole = 'cii.oldb:/cut/demoservice/instance1/double-scalar-sin#label', ''
w2.model = 'cii.oldb:/cut/demoservice/instance1/double-scalar-sin'
panel.show()
sys.exit(app.exec_())
|
The application looks like:
Taurus Labels using bgRole to change the information presented
Normal fragments included in a Taurus model are:
label
rvalue.quality
rvalue.magnitude
rvalue.units
rvalue.timestamp
range
alarm
warning
If a model needs, it can add fragments. Fragments are python properties.
6.10.2. Input Widgets
These are widgets that allow the user to modify a presented value. There are located in the taurus.qt.qtgui.input module. All of them inherit from TaurusBaseWritableWidget Pressing enter on them will trigger a write operation to the model backend.
All of them present the following graphical design pattern: when the value in the widget differs from the latest read value, the widgets is highlighted in blue. This indicates that there is still a change to be commited back into the control system.
As an examples, the following code can show how the widgets would look like:
1 2 3 4 5 6 7 8 9 10 11 12 13 14 15 16 17 18 19 20 21 22 23 | #!/opt/anaconda3/bin/python
import sys
from taurus.external.qt import Qt
from taurus.qt.qtgui.application import TaurusApplication
from taurus.qt.qtgui.input import TaurusValueLineEdit, TaurusValueSpinBox, TaurusWheelEdit
if __name__ == "__main__":
app = TaurusApplication(sys.argv, cmd_line_parser=None,)
panel = Qt.QWidget()
layout = Qt.QVBoxLayout()
panel.setLayout(layout)
w1, w2, w3 = TaurusValueLineEdit(), TaurusValueSpinBox(), TaurusWheelEdit()
layout.addWidget(w1)
layout.addWidget(w2)
layout.addWidget(w3)
w1.model = 'cii.oldb:/cut/demoservice/instance1/string-scalar-timestamp'
w2.model = 'cii.oldb:/cut/demoservice/instance1/int-scalar-add'
w3.model = 'cii.oldb:/cut/demoservice/instance1/double-scalar-sin'
panel.show()
sys.exit(app.exec_())
|
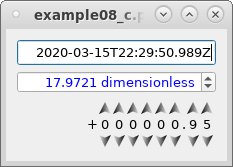
Inputs widgets, from top to bottom, TaurusValueLineEdit, TaurusValueSpinBox, TaurusWheelEdit.
6.10.3. Plotting Widgets
Taurus provides two set of plotting widgets, based on different libraries. One of them is based on guiqwt, and the other in PyQtGraph.
Due to availability of libraries in DevEnv, pyqtgraph support is included mainly for investigation purposes. The final plotting solution is not yet determined, but it should adhered to our requirements and taurus widget interface.
The widgets taurus_pyqtgraph offers:
TaurusTrend Plots the evolution over time of a scalar attribute.
TaurusPlot Plots a curve based on an Array attribute.
In the following example, the sine scalar attribute is use as model for a TaurusTrend widget:
1 2 3 4 5 6 7 8 9 10 11 12 13 14 15 | #!/opt/anaconda3/bin/python
import sys
from taurus.external.qt import Qt
from taurus.qt.qtgui.application import TaurusApplication
from taurus.qt.qtgui.plot import TaurusTrend, TaurusPlot
if __name__ == "__main__":
app = TaurusApplication(sys.argv, cmd_line_parser=None,)
panel = TaurusTrend()
model = ['cii.oldb:/cut/demoservice/instance1/double-scalar-sin']
panel.setModel(model)
panel.show()
sys.exit(app.exec_())
|
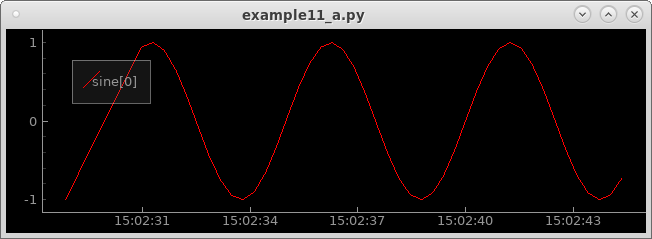
TaurusTrend widget from the program above.
This example is a bit more complex. Here we used a layout manager, to put side by side two widgets, one for plotting, the other one for trending. TaurusPlot is used to plot an Array attribute, gotten from the evaluation scheme, while the TaurusTrend widgets trends a sine and cosine scalar attributes:
1 2 3 4 5 6 7 8 9 10 11 12 13 14 15 16 17 18 19 20 21 | #!/opt/anaconda3/bin/python
import sys
from taurus.external.qt import Qt
from taurus.qt.qtgui.application import TaurusApplication
from taurus.qt.qtgui.plot import TaurusTrend, TaurusPlot
if __name__ == "__main__":
app = TaurusApplication(sys.argv, cmd_line_parser=None,)
panel = Qt.QWidget()
layout = Qt.QVBoxLayout()
panel.setLayout(layout)
plot = TaurusPlot()
plot_model = ['cii.oldb:/cut/demoservice/instance1/double-vector-sin']
plot.setModel(plot_model)
trend = TaurusTrend()
trend_model = ['cii.oldb:/cut/demoservice/instance1/double-scalar-sin','cii.oldb:/cut/demoservice/instance1/double-scalar-cos']
trend.setModel(trend_model)
layout.addWidget(plot)
layout.addWidget(trend)
panel.show()
sys.exit(app.exec_())
|
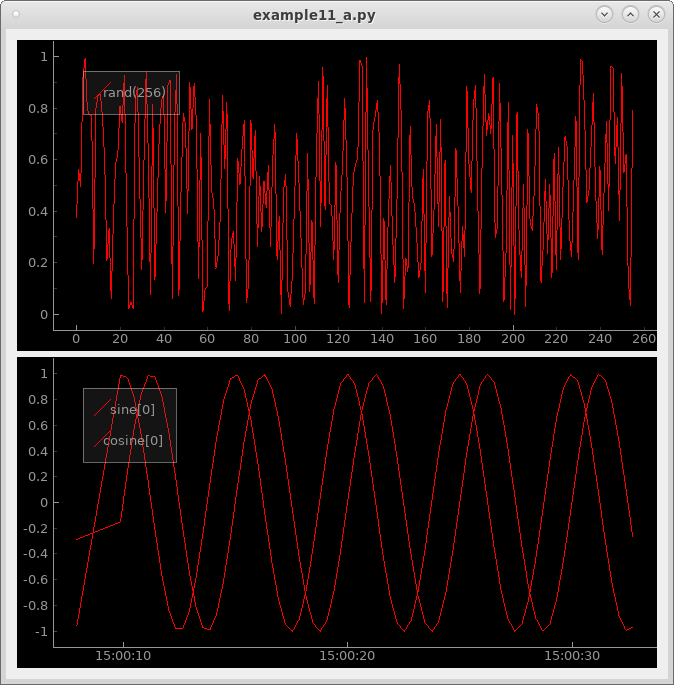
TaurusPlot and TaurusTrend widgets from the program above.
7. Contents of the example OLDB
You can use any of the datapoints in this list as part of taurus models:
cii.oldb:///cut/demoservice/instance1/boolean-scalar-fixedFixed booleancii.oldb:///cut/demoservice/instance1/int-scalar-addInteger datapoint, add 1 every updatecii.oldb:///cut/demoservice/instance1/double-scalar-addDouble datapoint adds 1 every updatecii.oldb:///cut/demoservice/instance1/double-scalar-sinDouble datapoint, returns the value of sin(t) with a period of 10 seconds.cii.oldb:///cut/demoservice/instance1/double-scalar-cosDouble datapoint, returns the value of cos(t) with a period of 10 seconds.cii.oldb:///cut/demoservice/instance1/double-scalar-tanDouble datapoint, returns the value of tan(t) with a period of 10 seconds.cii.oldb:///cut/demoservice/instance1/string-scalar-timestampString datapoint, published the ISO timestamp on the server.cii.oldb:///cut/demoservice/instance1/string-scalar-fixedString datapoint, fixed.cii.oldb:///cut/demoservice/instance1/double-vector-randVector of doubles, size 5, randomly generated between 0 and 1.cii.oldb:///cut/demoservice/instance1/double-vector-sinVector of 100 double datapoints, describes sin(t+dx) with period 2Pi covered of 10 secondscii.oldb:///cut/demoservice/instance1/double-vector-cosVector of 100 double datapoints, describes sin(t+dx) with period 2Pi covered of 10 secondscii.oldb:///cut/demoservice/instance1/double-vector-tanVector of 100 double datapoints, describes sin(t+dx) with period 2Pi covered of 10 secondscii.oldb:///cut/demoservice/instance1/double-matrix-sinMatrix of 16x16 double datapoints, describes sin(t+dx) with a period of 10 second fitted over x, copied over y.cii.oldb:///cut/demoservice/instance1/double-matrix-cosMatrix of 16x16 double datapoints, describes cos(t+dx) with a period of 10 second fitted over x, copied over y.cii.oldb:///cut/demoservice/instance1/double-matrix-sin-waveMatrix of 64x64 double datapoints, describes sin(t+dx+dy) with a period of 10 seconds.cii.oldb:///cut/demoservice/instance1/double-matrix-sin-cosMatrix of 101x101 double datapoints, describes sin(t+dx)*cos(t+dy) with a period of 10 seconds.
8. Debugging
8.1. Taurus Log Level
Any taurus command can change its logging output level using the option:
--log-level [Critical|Error|Warning|Info|Debug|Trace]
                                Show only logs with priority LEVEL or above
                                [default: Info]
A good first step to debug a TaurusWidget or Scheme Plugin is to enable trace level logs and see what is going on.
8.2. OLDB GUI
Sometimes is can be good to compare the values presented in Taurus with the one in the database. You can do this using the oldb-gui. Its will also present you the metadata of the datapoint, which is used by cii.oldb plugin to fill more details into the TaurusAttribute object.
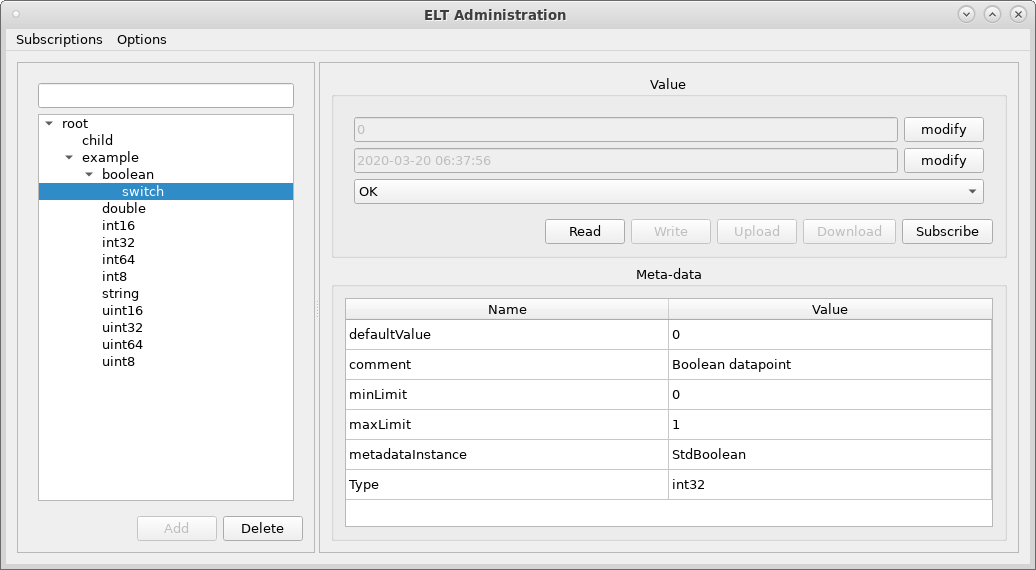
OLDB GUI. In the left there is a browsable tree view of the database contents, and the user can select a datapoint. On the right hand side are the details of the selected datapoint.
The OLDB GUI also allows you to subscribe to datapoints changes.
8.3. GDB
Since python is programmed in C, and we are using several bindings, some errors can come from the libraries developed in C++. To obtain more information, a developer may still use gdb:
     ]$ which <script_name>
     ]$ gdb
...
     (gdb) file python
     (gdb) run <return_of_which_command_above>
8.4. Python faulthandler
In case needed, you can get a more complete error or exception output using this:
python -q -X faulthandle [script_name]
You can use it in the interactive script console, or while executing a python file.
8.5. Python Debugger
Since Python 3.7, the breakpoint() method is part of the language. You can add them to your code at any point, and the python debugger will start immediately.
You can run any script with the python debugger.:
     ]$ python -m pdb <path_to_python_script.py>
...
(Pdb)        run
     (Pdb) continue
8.6. Profiler
We recommend to use Plop. Plop comes in two modules, one needed for collection of data, and the other one use to present the data. Here is how to use it:
]$ su - -c 'pip install plop'
]$ python -m plop.collector <script.py>
]$ python -m plop.viewer --datadir=profiles
The output of Plop is a very nicely constructure graph view of the calls. The size of the bubble indicate the ammount of time spend of the method, and the arrows indicate the backtrace to it.
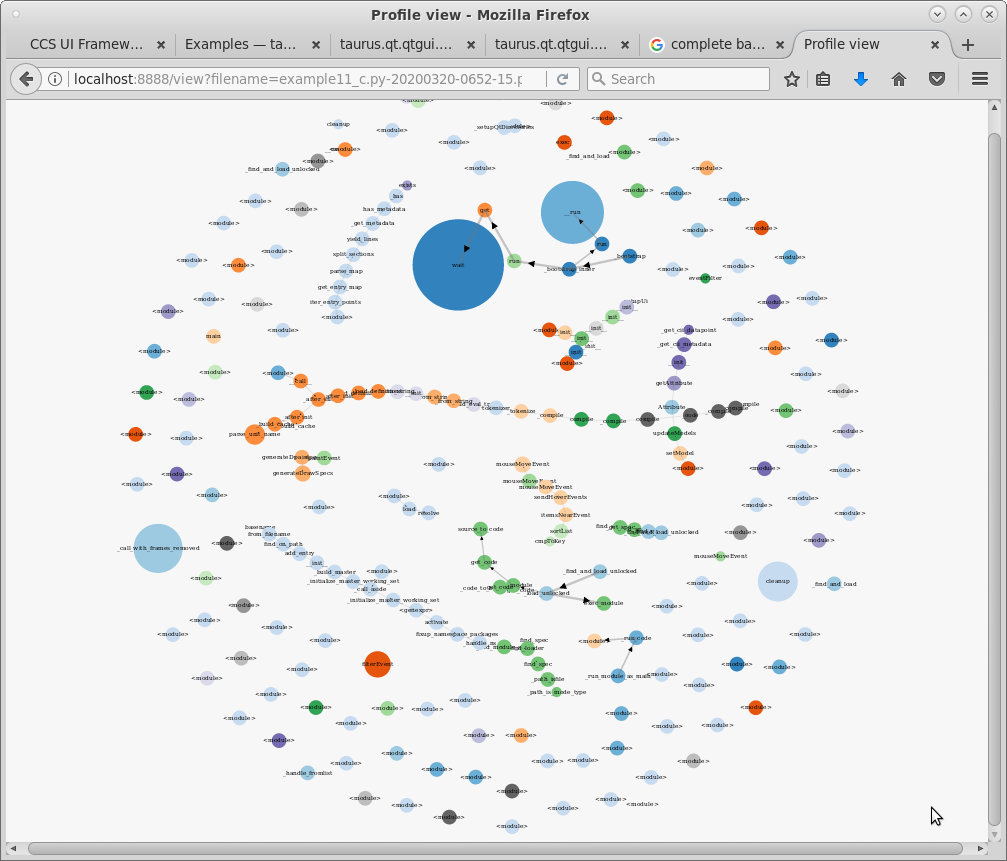
Plop viewer in action. It presents the information in a dynamic and interactive graph plot.