¡Lo lamentamos! Esta página no está disponible en su lengua seleccionada, en su lugar le mostramos la versión original.
Stability of HARPS velocity measurements during an observing night

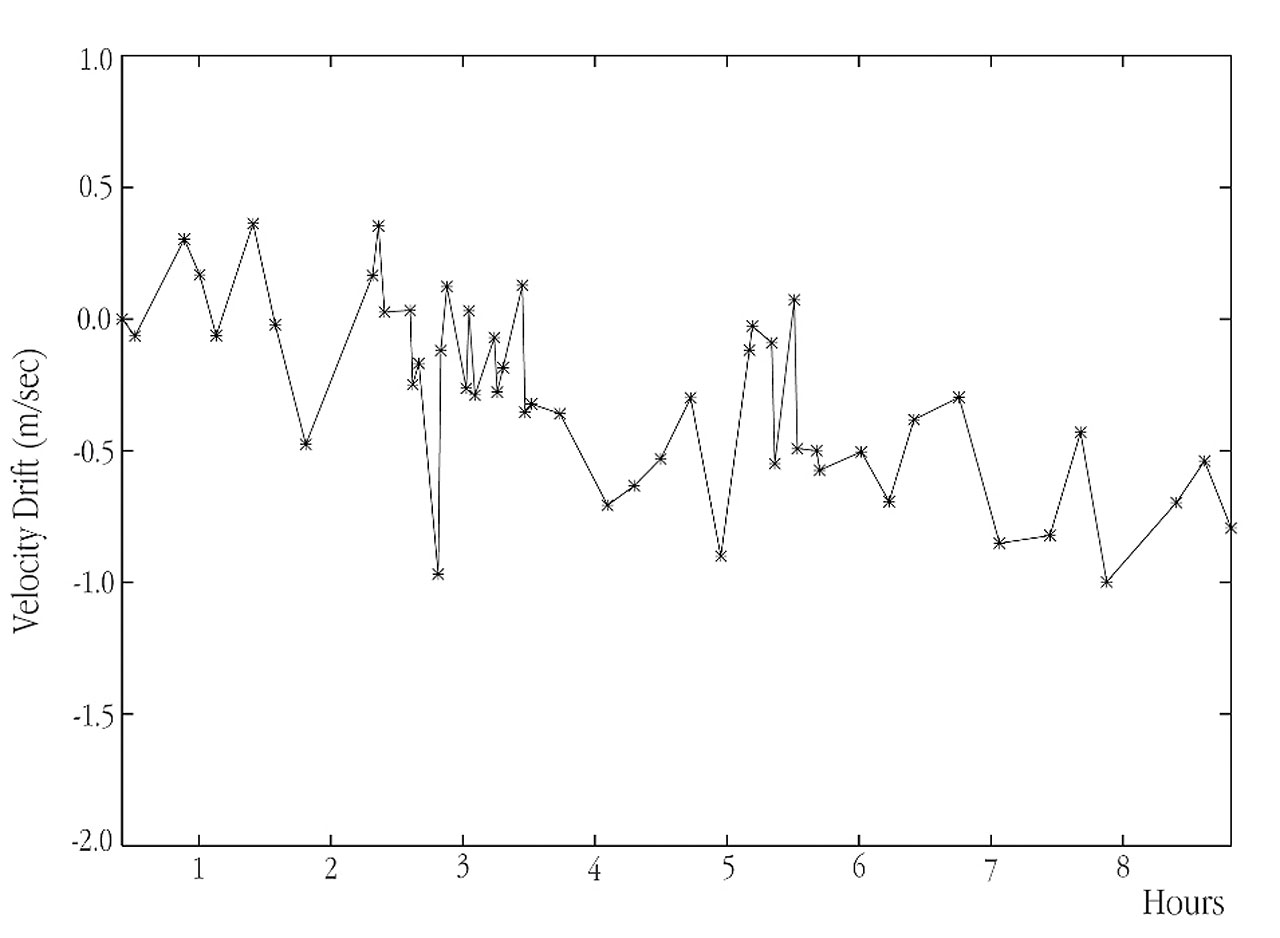
Powerful demonstration of the extraordinary stability of the HARPS spectrograph. It plots the instrumentally induced velocity change, as measured during one night (9 consecutive hours) in the commissioning period. The drift of the instrument is determined by computing the exact position of the Thorium emission lines. As can be seen, the drift is of the order of 1 m/s during 9 hours and is measured with an accuracy of only 20 cm/s.
Crédito:ESO
Sobre la imagen
| Identificador: | eso0308e |
| Tipo: | Mapa |
| Fecha de publicación: | 27 de Marzo de 2003 |
| Noticias relacionadas: | eso0308 |
| Tamaño: | 1902 x 1369 px |
Sobre el objeto
| Nombre: | Spectrograph |
| Tipo: | Unspecified : Technology : Observatory : Instrument |
| Categoría: | Illustrations |