Plot
? |
Symb
? |
Source
* |
Average ? |
Thresholds ? |
N_
data |
QC1
parameter |
Data
downloads |
Remarks |
| method |
value |
unit |
method |
value |
| 1 |
• | QC1DB |
none |
|
fraction |
VAL | 0.0,0.003 |
1 |
qc_twflat_expfitrms |
this |
last_yr |
all
|
rms in flux decay Ks |
| 2 |
• | QC1DB |
none |
|
fraction |
VAL | 0.0,0.003 |
1 |
qc_twflat_expfitrms |
this |
last_yr |
all
|
rms in flux decay J |
| 3 |
• | QC1DB |
none |
|
fraction |
VAL | 0.0,0.003 |
1 |
qc_twflat_expfitrms |
this |
last_yr |
all
|
rms in flux decay Z |
| 4 |
• | QC1DB |
none |
|
fraction |
VAL | 0.0,0.003 |
1 |
qc_twflat_expfitrms |
this |
last_yr |
all
|
rms in flux decay H |
| 5 |
• | QC1DB |
none |
|
fraction |
VAL | 0.0,0.003 |
1 |
qc_twflat_expfitrms |
this |
last_yr |
all
|
rms in flux decay Y |
| 6 |
• | QC1DB |
none |
|
fraction |
VAL | 0.0,0.003 |
0 |
qc_twflat_expfitrms |
this |
last_yr |
all
|
rms in flux decay NB118 |
| |
|
*Data sources: QC1DB: QC1 database; LOCAL: local data source
|
Plot 1
scores:  1| 1|
| | data source: | vircam_twilight
(QC1 database) |
| dataset: | qc_twflat_expfitrms | • |
| average: | none |
| fixed thresholds: | 0.0...0.003 | fraction |
| N_data plotted: | 1 |
| [click plot for closeup] |
Plot 2
scores: 1|
| | data source: | vircam_twilight
(QC1 database) |
| dataset: | qc_twflat_expfitrms | • |
| average: | none |
| fixed thresholds: | 0.0...0.003 | fraction |
| N_data plotted: | 1 |
| [click plot for closeup] |
Plot 3
scores: 1|
| | data source: | vircam_twilight
(QC1 database) |
| dataset: | qc_twflat_expfitrms | • |
| average: | none |
| fixed thresholds: | 0.0...0.003 | fraction |
| N_data plotted: | 1 |
| [click plot for closeup] |
Plot 4
scores: 1|
| | data source: | vircam_twilight
(QC1 database) |
| dataset: | qc_twflat_expfitrms | • |
| average: | none |
| fixed thresholds: | 0.0...0.003 | fraction |
| N_data plotted: | 1 |
| [click plot for closeup] |
Plot 5
scores: 1|
| | data source: | vircam_twilight
(QC1 database) |
| dataset: | qc_twflat_expfitrms | • |
| average: | none |
| fixed thresholds: | 0.0...0.003 | fraction |
| N_data plotted: | 1 |
| [click plot for closeup] |
Plot 6
scores: 1|
| | data source: | vircam_twilight
(QC1 database) |
| dataset: | qc_twflat_expfitrms | • |
| average: | none |
| fixed thresholds: | 0.0...0.003 | fraction |
| N_data plotted: | 0 |
| [click plot for closeup] |
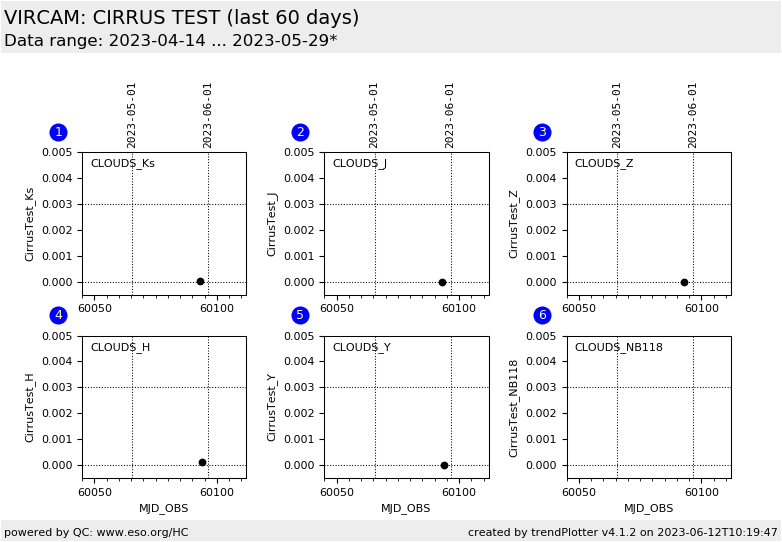
Trending plot for CirrusTest Parameter obtained from detector 10. (since 2018-10-01: for EXTNAME=AVG)
QC parameters is derived from the twilight flat raw flux sequence of detetcor #10. (Since 2018-10-01: for the average over 16 detectors)
Name:
Fits header: (not available),
QC1 DB: qc_twilight_expfitrms
Description:
Under photometric and clear conditions the sky brightness is (de)inreases during (dusk)dawn in a continuous manner.
Thin or thick cirrus moving through the FOV disturb the continuous flux trend.
The function flux(time)= A + B * exp ( - C * (D - time)) is fit to the raw flux
sequence and the RMS of the fit is considered as a measure of the sky
brightness continuity within the FOV.
The CirrusTest parameter is the RMS of the exponential fit to fluxes
retrieved from the twilight flat raw frames.
It is a quality parameter of the master twilight flat.
Twilight flat flux sequences with significant deviantions from flux(time) will be discarded.
Setup:
INS.FILT1.NAME = Ks, J, H, Y, Z, NB118
Find more information on the VIRCAM TWILIGHT FLAT tutorial page.
and on the VIRCAM QC and problems page.
General information
Click on any of the plots to see a close-up version.
The latest date is indicated on top of the plot.
If configured,
- data points belonging to the latest date are specially marked
- statistical averages are indicated by a solid line, and thresholds by broken lines
- outliers are marked by a red asterisk. They are defined as data points outside the
threshold lines
- "aliens" (= data points outside the plot Y limits) are marked by a red arrow (↑ or ↓)
- you can download the data for each parameter set if the 'Data downloads' link shows up
|
