PIONIER trending system: FULL report
Last update: 2025-11-18T12:25:31 (UT)
[enable javascript for displaying time difference!]
*Date on this monitor changes at 21:00 UT
Plot? Symb? Source Average ? Thresholds ? N_ QC1 Data Remarks
method value unit method value
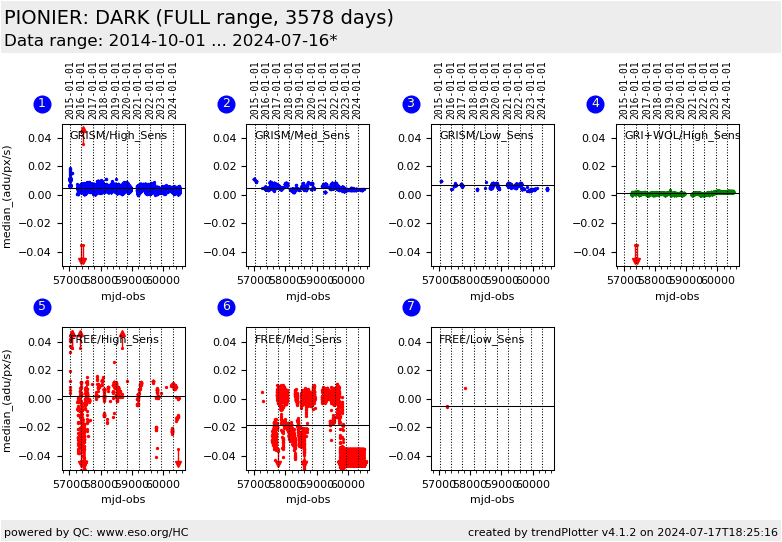
1
• QC1DB MEDIAN 0.00474 NONE none 17075 dark_med
all (full time range)
GRISM High sensitivity (polar.voltage 7100)
2
• QC1DB MEDIAN 0.00463 NONE none 2977 dark_med
all (full time range)
GRISM Medium sensitivity (polar.voltage 5000)
3
• QC1DB MEDIAN 0.00621 NONE none 740 dark_med
all (full time range)
GRISM Low sensitivity (polar.voltage 3000)
4
• QC1DB MEDIAN 0.00128 NONE none 3720 dark_med
all (full time range)
GRISM+WOL High sensitivity (polar.voltage 7100)
5
• QC1DB MEDIAN 0.00163 NONE none 911 dark_med
all (full time range)
FREE High sensitivity (polar.voltage 7100)
6
• QC1DB MEDIAN -0.0241 NONE none 3201 dark_med
all (full time range)
FREE Medium sensitivity (polar.voltage 5000)
7
• QC1DB MEDIAN -0.00532 NONE none 3 dark_med
all (full time range)
FREE Low sensitivity (polar.voltage 3000)
8
• QC1DB MEDIAN NONE none 0 dark_med
all (full time range)
FREE Low sensitivity (polar.voltage 1000)
*Data sources: QC1DB: QC1 database; LOCAL: local data source
Plot 1 scores: not implemented
data source: pionier_dark dataset: dark_med • median: 0.00474 NONE thresholds: none N_data plotted: 17075 [click plot for closeup]
Plot 2 scores: not implemented
data source: pionier_dark dataset: dark_med • median: 0.00463 NONE thresholds: none N_data plotted: 2977 [click plot for closeup]
Plot 3 scores: not implemented
data source: pionier_dark dataset: dark_med • median: 0.00621 NONE thresholds: none N_data plotted: 740 [click plot for closeup]
Plot 4 scores: not implemented
data source: pionier_dark dataset: dark_med • median: 0.00128 NONE thresholds: none N_data plotted: 3720 [click plot for closeup]
Plot 5 scores: not implemented
data source: pionier_dark dataset: dark_med • median: 0.00163 NONE thresholds: none N_data plotted: 911 [click plot for closeup]
Plot 6 scores: not implemented
data source: pionier_dark dataset: dark_med • median: -0.0241 NONE thresholds: none N_data plotted: 3201 [click plot for closeup]
Plot 7 scores: not implemented
data source: pionier_dark dataset: dark_med • median: -0.00532 NONE thresholds: none N_data plotted: 3 [click plot for closeup]
Plot 8 scores: not implemented
data source: pionier_dark dataset: dark_med • median: no data NONE thresholds: none N_data plotted: 0 [click plot for closeup]
This plot
DARKs are taken once a day as day-time calibrations as well as at night within
each OB.
General information
Click on any of the plots to see a close-up version .
The latest date is indicated on top of the plot.
If configured,
data points belonging to the latest date are specially marked statistical averages are indicated by a solid line, and thresholds by broken lines outliers are marked by a red asterisk. They are defined as data points outside the
threshold lines "aliens" (= data points outside the plot Y limits) are marked by a red arrow (↑ ↓ you can download the data for each parameter set if the 'Data downloads' link shows up
