|
|
| PIONIER trending system: HISTORY report |
|
|
|
Last update: 2019-07-15T01:26:16 (UT)
|
|
|
|
|
*Date on this monitor changes at 21:00 UT |
|

|
|
|
Plot
? |
Symb
? |
Source
* |
Average ? |
Thresholds ? |
N_
data |
QC1
parameter |
Data
downloads |
Remarks |
| method |
value |
unit |
method |
value |
| 1 |
• | QC1DB |
none |
|
NONE |
none | |
90 |
kappa_avg12 |
this |
last_yr |
all
|
GRISM, High Sensitivity: Baseline12 |
| 1 |
• | QC1DB |
none |
|
NONE |
none | |
90 |
kappa_avg13 |
this |
last_yr |
all
|
Baseline13 |
| 1 |
• | QC1DB |
none |
|
NONE |
none | |
90 |
kappa_avg14 |
this |
last_yr |
all
|
Baseline14 |
| 1 |
• | QC1DB |
none |
|
NONE |
none | |
90 |
kappa_avg23 |
this |
last_yr |
all
|
Baseline23 |
| 1 |
• | QC1DB |
none |
|
NONE |
none | |
90 |
kappa_avg24 |
this |
last_yr |
all
|
Baseline24 |
| 1 |
• | QC1DB |
none |
|
NONE |
none | |
90 |
kappa_avg34 |
this |
last_yr |
all
|
Baseline34 |
|
| 2 |
• | QC1DB |
none |
|
NONE |
none | |
0 |
kappa_avg12 |
this |
last_yr |
all
|
GRISM, Medium Sensitivity: Baseline12 |
| 2 |
• | QC1DB |
none |
|
NONE |
none | |
0 |
kappa_avg13 |
this |
last_yr |
all
|
Baseline13 |
| 2 |
• | QC1DB |
none |
|
NONE |
none | |
0 |
kappa_avg14 |
this |
last_yr |
all
|
Baseline14 |
| 2 |
• | QC1DB |
none |
|
NONE |
none | |
0 |
kappa_avg23 |
this |
last_yr |
all
|
Baseline23 |
| 2 |
• | QC1DB |
none |
|
NONE |
none | |
0 |
kappa_avg24 |
this |
last_yr |
all
|
Baseline24 |
| 2 |
• | QC1DB |
none |
|
NONE |
none | |
0 |
kappa_avg34 |
this |
last_yr |
all
|
Baseline34 |
|
| 3 |
• | QC1DB |
none |
|
NONE |
none | |
0 |
kappa_avg12 |
this |
last_yr |
all
|
GRISM, Low Sensitivity: Baseline12 |
| 3 |
• | QC1DB |
none |
|
NONE |
none | |
0 |
kappa_avg13 |
this |
last_yr |
all
|
Baseline13 |
| 3 |
• | QC1DB |
none |
|
NONE |
none | |
0 |
kappa_avg14 |
this |
last_yr |
all
|
Baseline14 |
| 3 |
• | QC1DB |
none |
|
NONE |
none | |
0 |
kappa_avg23 |
this |
last_yr |
all
|
Baseline23 |
| 3 |
• | QC1DB |
none |
|
NONE |
none | |
0 |
kappa_avg24 |
this |
last_yr |
all
|
Baseline24 |
| 3 |
• | QC1DB |
none |
|
NONE |
none | |
0 |
kappa_avg34 |
this |
last_yr |
all
|
Baseline34 |
|
| 4 |
• | QC1DB |
none |
|
NONE |
none | |
0 |
kappa_avg12 |
this |
last_yr |
all
|
FREE, High Sensitivity: Baseline12 |
| 4 |
• | QC1DB |
none |
|
NONE |
none | |
0 |
kappa_avg13 |
this |
last_yr |
all
|
Baseline13 |
| 4 |
• | QC1DB |
none |
|
NONE |
none | |
0 |
kappa_avg14 |
this |
last_yr |
all
|
Baseline14 |
| 4 |
• | QC1DB |
none |
|
NONE |
none | |
0 |
kappa_avg23 |
this |
last_yr |
all
|
Baseline23 |
| 4 |
• | QC1DB |
none |
|
NONE |
none | |
0 |
kappa_avg24 |
this |
last_yr |
all
|
Baseline24 |
| 4 |
• | QC1DB |
none |
|
NONE |
none | |
0 |
kappa_avg34 |
this |
last_yr |
all
|
Baseline34 |
|
| 5 |
• | QC1DB |
none |
|
NONE |
none | |
90 |
kappa_avg12 |
this |
last_yr |
all
|
FREE, Medium Sensitivity: Baseline12 |
| 5 |
• | QC1DB |
none |
|
NONE |
none | |
90 |
kappa_avg13 |
this |
last_yr |
all
|
Baseline13 |
| 5 |
• | QC1DB |
none |
|
NONE |
none | |
90 |
kappa_avg14 |
this |
last_yr |
all
|
Baseline14 |
| 5 |
• | QC1DB |
none |
|
NONE |
none | |
90 |
kappa_avg23 |
this |
last_yr |
all
|
Baseline23 |
| 5 |
• | QC1DB |
none |
|
NONE |
none | |
90 |
kappa_avg24 |
this |
last_yr |
all
|
Baseline24 |
| 5 |
• | QC1DB |
none |
|
NONE |
none | |
90 |
kappa_avg34 |
this |
last_yr |
all
|
Baseline34 |
|
| 6 |
• | QC1DB |
none |
|
NONE |
none | |
0 |
kappa_avg12 |
this |
last_yr |
all
|
FREE, Low Sensitivity: Baseline12 |
| 6 |
• | QC1DB |
none |
|
NONE |
none | |
0 |
kappa_avg13 |
this |
last_yr |
all
|
Baseline13 |
| 6 |
• | QC1DB |
none |
|
NONE |
none | |
0 |
kappa_avg14 |
this |
last_yr |
all
|
Baseline14 |
| 6 |
• | QC1DB |
none |
|
NONE |
none | |
0 |
kappa_avg23 |
this |
last_yr |
all
|
Baseline23 |
| 6 |
• | QC1DB |
none |
|
NONE |
none | |
0 |
kappa_avg24 |
this |
last_yr |
all
|
Baseline24 |
| 6 |
• | QC1DB |
none |
|
NONE |
none | |
0 |
kappa_avg34 |
this |
last_yr |
all
|
Baseline34 |
|
| |
|
*Data sources: QC1DB: QC1 database; LOCAL: local data source
|
| Plot 1 | | data source: | pionier_kappa_matrix
(QC1 database) |
dataset:
(numbers below apply to this dataset) | kappa_avg12 | • |
| average: | none |
| thresholds: | none |
| N_data plotted: | 90 |
| [click plot for closeup] |
| Plot 2 | | data source: | pionier_kappa_matrix
(QC1 database) |
dataset:
(numbers below apply to this dataset) | kappa_avg12 | • |
| average: | none |
| thresholds: | none |
| N_data plotted: | 0 |
| [click plot for closeup] |
| Plot 3 | | data source: | pionier_kappa_matrix
(QC1 database) |
dataset:
(numbers below apply to this dataset) | kappa_avg12 | • |
| average: | none |
| thresholds: | none |
| N_data plotted: | 0 |
| [click plot for closeup] |
| Plot 4 | | data source: | pionier_kappa_matrix
(QC1 database) |
dataset:
(numbers below apply to this dataset) | kappa_avg12 | • |
| average: | none |
| thresholds: | none |
| N_data plotted: | 0 |
| [click plot for closeup] |
| Plot 5 | | data source: | pionier_kappa_matrix
(QC1 database) |
dataset:
(numbers below apply to this dataset) | kappa_avg12 | • |
| average: | none |
| thresholds: | none |
| N_data plotted: | 90 |
| [click plot for closeup] |
| Plot 6 | | data source: | pionier_kappa_matrix
(QC1 database) |
dataset:
(numbers below apply to this dataset) | kappa_avg12 | • |
| average: | none |
| thresholds: | none |
| N_data plotted: | 0 |
| [click plot for closeup] |
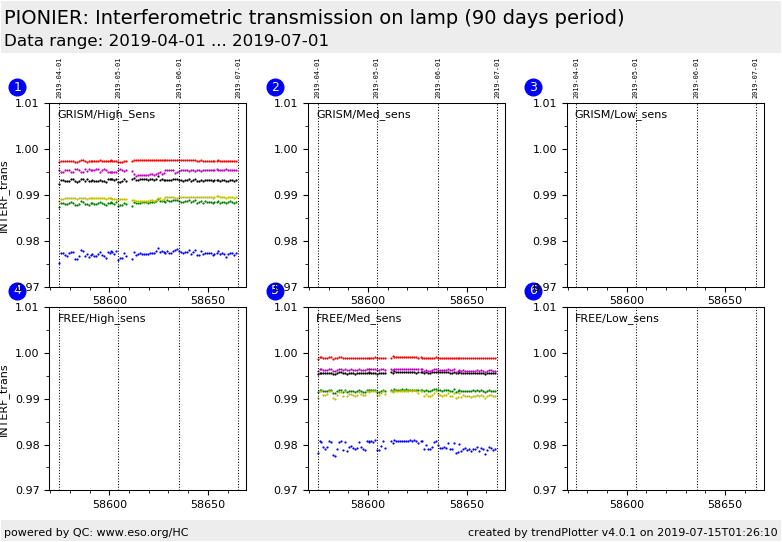
Data are taken with an internal lamp to measure the transmission of the PIONIER instrument.
Only the science outputs are illuminated.
The first sets of plots (KAPPA_High_Sensitivity KAPPA_Medium_Sensitivity and KAPPA) show the
interfermetric transmission of PIONIER (ratio of the transmission between the pairs of interferometric arms), also called KAPPA_MATRIX.
The last set of plots (Kappa_beam_High_Sensitivity and Kappa_beam) shows the transmission of the individual
arms.
- "KAPPA_High_Sensitivity" plots show this ratio for the GRISM
and for the 6 combinations of baselines :12,13,14,23,24,34. The FREE data cannot be taken because of saturation
- "KAPPA_Medium_Sensitivity" plots show this ratio for the 2 dispersive elements GRISM and FREE
and for the 6 combinations of baselines :12,13,14,23,24,34
- "KAPPA" show the same information than in the previous plot for the
High_Sensitivity, Medium_Sensitivity and Low_Sensitivity
- "KAPPA_beam_High_Sensitivity" shows the number of counts in the different arms (1 to 4) of PIONIER for the High Sensitivity mode. The saturation is around 4000 ADUs
- "KAPPA_beam" shows the number of counts in the different arms (1 to 4) of PIONIERi for the 3 Sensitivity modes.
The saturation is around 4000 ADUs
The same data are also taken on sky and the Interferometric transmission is
then calculated on the full optical path (from the telescope to the
detector) This is shown under "Intf Transmission (sky)".
The detector polarization voltages (DET.POLAR) are :
High Sensitivity : 7100 mV
Medium_ Sensitivity: 5000 mV
Low_Sensitivity : 1000 mV
General information
Click on any of the plots to see a close-up version.
The latest date is indicated on top of the plot.
If configured,
- data points belonging to the latest date are specially marked
- statistical averages are indicated by a solid line, and thresholds by broken lines
- outliers are marked by a red asterisk. They are defined as data points outside the
threshold lines
- "aliens" (= data points outside the plot Y limits) are marked by a red arrow (↑ or ↓)
- you can download the data for each parameter set if the 'Data downloads' link shows up
|
|