|
|
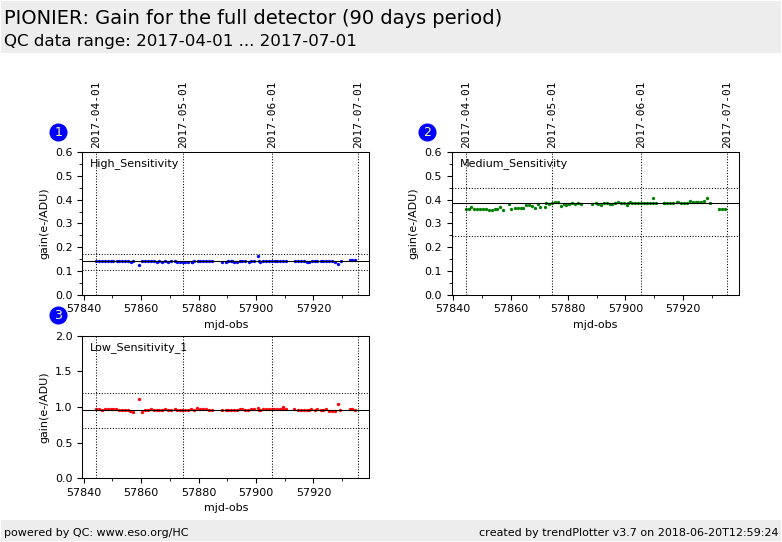
| PIONIER trending system: HISTORY report |
|
|
|
Last update: 2018-06-20T12:59:28 (UT)
|
|
|
|
|
*Date on this monitor changes at 21:00 UT |
|

|
|
|
Plot
? |
Symb
? |
Source
* |
Average ? |
Thresholds ? |
N_
data |
QC1
parameter |
Data
downloads |
Remarks |
| method |
value |
unit |
method |
value |
| 1 |
• | QC1DB |
MEDIAN |
0.141 |
NONE |
VAL | 0.105,0.17 |
86 |
gain_median |
this |
last_yr |
all
|
High sensitivity |
| 2 |
• | QC1DB |
MEDIAN |
0.384 |
NONE |
VAL | 0.249,0.45 |
86 |
gain_median |
this |
last_yr |
all
|
Medium sensitivity |
| 3 |
• | QC1DB |
MEDIAN |
0.962 |
NONE |
VAL | 0.7,1.2 |
85 |
gain_median |
this |
last_yr |
all
|
Low sensitivity (detector polarisation voltage 3000mV) |
| |
|
*Data sources: QC1DB: QC1 database; LOCAL: local data source
|
| Plot 1 | | data source: | pionier_detmon
(QC1 database) |
| dataset: | gain_median | • |
| median: | 0.141 | NONE |
| fixed thresholds: | 0.105...0.17 | NONE |
| N_data plotted: | 86 |
| [click plot for closeup] |
| Plot 2 | | data source: | pionier_detmon
(QC1 database) |
| dataset: | gain_median | • |
| median: | 0.384 | NONE |
| fixed thresholds: | 0.249...0.45 | NONE |
| N_data plotted: | 86 |
| [click plot for closeup] |
| Plot 3 | | data source: | pionier_detmon
(QC1 database) |
| dataset: | gain_median | • |
| median: | 0.962 | NONE |
| fixed thresholds: | 0.7...1.2 | NONE |
| N_data plotted: | 85 |
| [click plot for closeup] |
The gain is monitored for the full detector (320x255) and for the
"science" pixels (26 windows of 6x1 pixels).
Only the gain across the full detector is scored
The gain has been measured after installation of RAPID (december 2014):
Low_Sensitivity:
- det_polar=1000mv gain=1.398 e-/ADU
- det_polar=3000mv gain=0.861 e-/ADU
Medium_Sensitivity:
- det_polar=5000mv gain=0.296 e-/ADU
High Sensitivity:
- det_polar=7100mv gain=0.107 e-/ADU
General information
Click on any of the plots to see a close-up version.
The latest date is indicated on top of the plot.
If configured,
- data points belonging to the latest date are specially marked
- statistical averages are indicated by a solid line, and thresholds by broken lines
- outliers are marked by a red asterisk. They are defined as data points outside the
threshold lines
- "aliens" (= data points outside the plot Y limits) are marked by a red arrow (↑ or ↓)
- you can download the data for each parameter set if the 'Data downloads' link shows up
|