|
|
| PIONIER trending system: HISTORY report |
|
|
|
Last update: 2018-06-20T12:48:18 (UT)
|
|
|
|
|
*Date on this monitor changes at 21:00 UT |
|

|
|
|
Plot
? |
Symb
? |
Source
* |
Average ? |
Thresholds ? |
N_
data |
QC1
parameter |
Data
downloads |
Remarks |
| method |
value |
unit |
method |
value |
| 1 |
• | QC1DB |
MEDIAN |
3 |
NONE |
VAL | 0,5 |
85 |
bpm_badpix_masked |
this |
last_yr |
all
|
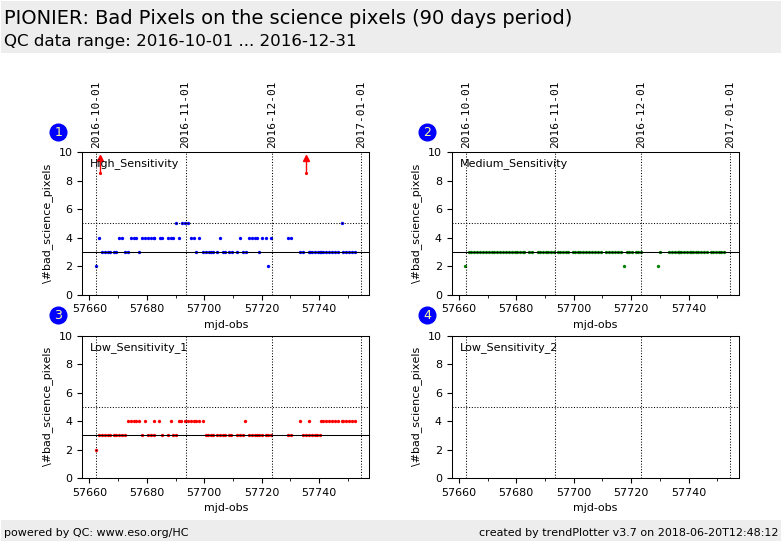
High sensitivity (det.polar=7100) |
| 2 |
• | QC1DB |
MEDIAN |
3 |
NONE |
VAL | 0,5 |
85 |
bpm_badpix_masked |
this |
last_yr |
all
|
Medium sensitivity (det.polar=5000) |
| 3 |
• | QC1DB |
MEDIAN |
3 |
NONE |
VAL | 0,5 |
84 |
bpm_badpix_masked |
this |
last_yr |
all
|
Low sensitivity (det.polar=3000) |
| 4 |
• | QC1DB |
MEDIAN |
|
NONE |
VAL | 0,5 |
0 |
bpm_badpix_masked |
this |
last_yr |
all
|
Low sensitivity (det.polar=1000) |
| |
|
*Data sources: QC1DB: QC1 database; LOCAL: local data source
|
| Plot 1 | | data source: | pionier_detmon
(QC1 database) |
| dataset: | bpm_badpix_masked | • |
| median: | 3 | NONE |
| fixed thresholds: | 0...5 | NONE |
| N_data plotted: | 85 |
| [click plot for closeup] |
| Plot 2 | | data source: | pionier_detmon
(QC1 database) |
| dataset: | bpm_badpix_masked | • |
| median: | 3 | NONE |
| fixed thresholds: | 0...5 | NONE |
| N_data plotted: | 85 |
| [click plot for closeup] |
| Plot 3 | | data source: | pionier_detmon
(QC1 database) |
| dataset: | bpm_badpix_masked | • |
| median: | 3 | NONE |
| fixed thresholds: | 0...5 | NONE |
| N_data plotted: | 84 |
| [click plot for closeup] |
| Plot 4 | | data source: | pionier_detmon
(QC1 database) |
| dataset: | bpm_badpix_masked | • |
| median: | no data | NONE |
| fixed thresholds: | 0...5 | NONE |
| N_data plotted: | 0 |
| [click plot for closeup] |
The number of bad pixels is shown for the full detector (320x255) and for the "science" pixels (26 windows of 6x1 pixels).
Only the number of bad pixels on the science is scored.
There are 2 known bad pixels and 1 saturated one in the science pixels:
- hot pixel (in dark) output 25, channel 5
- hot pixel (in science) output 19, channel 5
- saturated pixel (in science) output 20, channel 1.
This pixel saturates at
600ADU while the others saturate around 4000ADU
The detector polarization voltage (DET.POLAR) are :
- High Sensitivity : 7100 mV
- Medium_Sensitivity: 5000 mV
- Low_Sensitivity : 3000mV and 1000 mV
General information
Click on any of the plots to see a close-up version.
The latest date is indicated on top of the plot.
If configured,
- data points belonging to the latest date are specially marked
- statistical averages are indicated by a solid line, and thresholds by broken lines
- outliers are marked by a red asterisk. They are defined as data points outside the
threshold lines
- "aliens" (= data points outside the plot Y limits) are marked by a red arrow (↑ or ↓)
- you can download the data for each parameter set if the 'Data downloads' link shows up
|