Plot
? |
Symb
? |
Source
* |
Average ? |
Thresholds ? |
N_
data |
QC1
parameter |
Data
downloads |
Remarks |
| method |
value |
unit |
method |
value |
| 1 |
• | QC1DB |
none |
|
ADU |
none | |
5734 |
qc_ron23 |
all (full time range)
| Mean DARK ReadOut Noise, chip 4, DIT=2.0 |
| 2 |
• | QC1DB |
none |
|
ADU |
none | |
5740 |
qc_ron23 |
all (full time range)
| Mean DARK ReadOut Noise, chip 3, DIT=2.0 |
| 3 |
• | QC1DB |
none |
|
ADU |
none | |
5176 |
qc_ron23 |
all (full time range)
| Mean DARK ReadOut Noise, chip 4, DIT=300 |
| 4 |
• | QC1DB |
none |
|
ADU |
none | |
5176 |
qc_ron23 |
all (full time range)
| Mean DARK ReadOut Noise, chip 3, DIT=300 |
| 5 |
• | QC1DB |
none |
|
ADU |
none | |
5750 |
qc_ron23 |
all (full time range)
| Mean DARK ReadOut Noise, chip 1, DIT=2.0 |
| 6 |
• | QC1DB |
none |
|
ADU |
none | |
5735 |
qc_ron23 |
all (full time range)
| Mean DARK ReadOut Noise, chip 2, DIT=2.0 |
| 7 |
• | QC1DB |
none |
|
ADU |
none | |
5176 |
qc_ron23 |
all (full time range)
| Mean DARK ReadOut Noise, chip 1, DIT=300 |
| 8 |
• | QC1DB |
none |
|
ADU |
none | |
5175 |
qc_ron23 |
all (full time range)
| Mean DARK ReadOut Noise, chip 2, DIT=300 |
| |
|
*Data sources: QC1DB: QC1 database; LOCAL: local data source
|
| Plot 5 | | data source: | hawki_dark
(QC1 database) |
| dataset: | qc_ron23 | • |
| average: | none |
| thresholds: | none |
| N_data plotted: | 5750 |
| (current) reference: | 9.68 |
| [click plot for closeup] |
| Plot 6 | | data source: | hawki_dark
(QC1 database) |
| dataset: | qc_ron23 | • |
| average: | none |
| thresholds: | none |
| N_data plotted: | 5735 |
| (current) reference: | 8.9 |
| [click plot for closeup] |
| Plot 2 | | data source: | hawki_dark
(QC1 database) |
| dataset: | qc_ron23 | • |
| average: | none |
| thresholds: | none |
| N_data plotted: | 5740 |
| (current) reference: | 8.11 |
| [click plot for closeup] |
| Plot 1 | | data source: | hawki_dark
(QC1 database) |
| dataset: | qc_ron23 | • |
| average: | none |
| thresholds: | none |
| N_data plotted: | 5734 |
| (current) reference: | 8.24 |
| [click plot for closeup] |
| Plot 7 | | data source: | hawki_dark
(QC1 database) |
| dataset: | qc_ron23 | • |
| average: | none |
| thresholds: | none |
| N_data plotted: | 5176 |
| (current) reference: | 6.05 |
| [click plot for closeup] |
| Plot 8 | | data source: | hawki_dark
(QC1 database) |
| dataset: | qc_ron23 | • |
| average: | none |
| thresholds: | none |
| N_data plotted: | 5175 |
| (current) reference: | 5.4 |
| [click plot for closeup] |
| Plot 4 | | data source: | hawki_dark
(QC1 database) |
| dataset: | qc_ron23 | • |
| average: | none |
| thresholds: | none |
| N_data plotted: | 5176 |
| (current) reference: | 5.48 |
| [click plot for closeup] |
| Plot 3 | | data source: | hawki_dark
(QC1 database) |
| dataset: | qc_ron23 | • |
| average: | none |
| thresholds: | none |
| N_data plotted: | 5176 |
| (current) reference: | 4.66 |
| [click plot for closeup] |
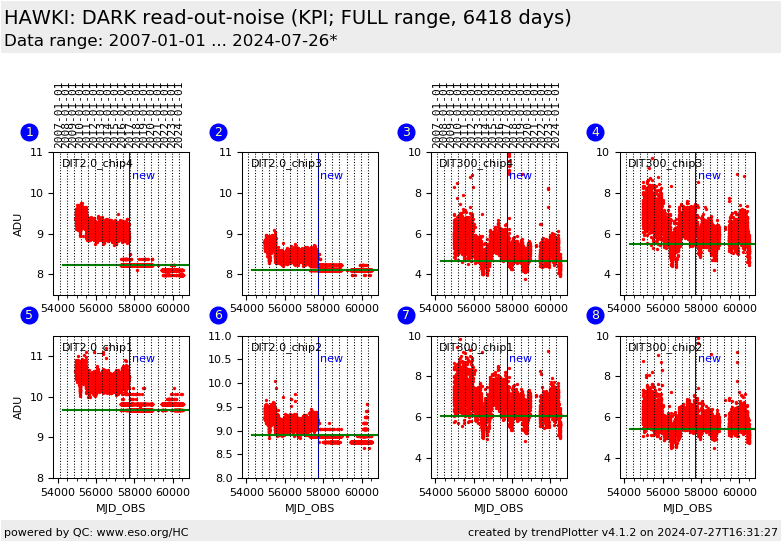
This is intrument performance plot for the HAWKI detectors'
ReadOut Noise [RON] of the master dark.
QC parameter is derived for each detector of the raw dark frames.
Only the "NonDest" readout mode is monitored.
On 2016-11-19 new CASU pipeline was adopted (blue vertical line).
The reference value for each detector for monitore DET.DIT=2s and
300s is currently identical to the median of the measured values.
These plots describe:
Fig. 1. chip4: The QC parameter for DIT=2.0 for chip #4. Reference value: 8.245
Fig. 2. chip3: The QC parameter for DIT=2.0 for chip #3. Reference value: 8.11
Fig. 3. chip4: The QC parameter for DIT=300.0 for chip #4. Reference value: 4.66
Fig. 4. chip3: The QC parameter for DIT=300.0 for chip #3. Reference value: 5.48
Fig. 5. chip1: The QC parameter for DIT=2.0 for chip #1. Reference value: 9.68
Fig. 6. chip2: The QC parameter for DIT=2.0 for chip #2. Reference value: 8.9
Fig. 7. chip1: The QC parameter for DIT=300.0 for chip #1 Reference value: 6.05
Fig. 8. chip2: The QC parameter for DIT=300.0 for chip #2. Reference value: 5.4
General information
Click on any of the plots to see a close-up version.
The latest date is indicated on top of the plot.
If configured,
- data points belonging to the latest date are specially marked
- statistical averages are indicated by a solid line, and thresholds by broken lines
- outliers are marked by a red asterisk. They are defined as data points outside the
threshold lines
- "aliens" (= data points outside the plot Y limits) are marked by a red arrow (↑ or ↓)
- you can download the data for each parameter set if the 'Data downloads' link shows up
|
