ERIS trending system: HEALTH CHECK report
Last update: 2026-01-22T12:19:23 (UT)
[enable javascript for displaying time difference!]
General news:
NOTE: The Health Check and calChecker services are moved to qcFlow on an instrument by instrument basis. The current pages will not be updated any longer once the move has been finished.
ERIS news:
Report news:
Plot? Symb? Source Average ? Thresholds ? N_ QC1 Data Remarks
method value unit method value
1
• QC1DB MEDIAN 0.172 NONE VAL 0.005,0.279 7 qc_eff_median
this |
last_yr |
all
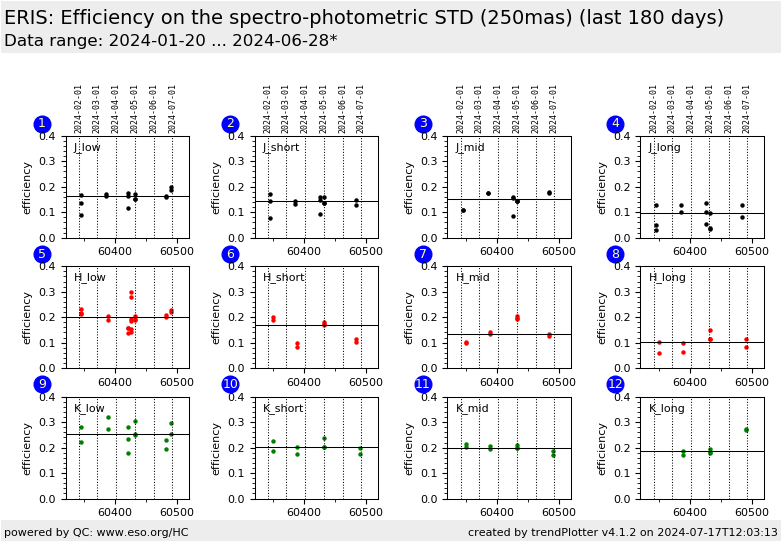
efficiency J-band_low (averaged on bins) 250mas
2
• QC1DB MEDIAN 0.134 NONE VAL 0.005,0.312 5 qc_eff_median
this |
last_yr |
all
efficiency J-band_short
3
• QC1DB MEDIAN 0.126 NONE VAL 0.005,0.314 5 qc_eff_median
this |
last_yr |
all
efficiency J-band_middle
4
• QC1DB MEDIAN 0.104 NONE VAL 0.005,0.211 4 qc_eff_median
this |
last_yr |
all
efficiency J-band_long
5
• QC1DB MEDIAN 0.202 NONE VAL 0.005,0.437 7 qc_eff_median
this |
last_yr |
all
efficiency H-band_low (averaged on bins) 250mas
6
• QC1DB MEDIAN 0.184 NONE VAL 0.005,0.387 4 qc_eff_median
this |
last_yr |
all
efficiency H-band_short
7
• QC1DB MEDIAN 0.141 NONE VAL 0.005,0.389 4 qc_eff_median
this |
last_yr |
all
efficiency H-band_middle
8
• QC1DB MEDIAN 0.134 NONE VAL 0.005,0.277 4 qc_eff_median
this |
last_yr |
all
efficiency H-band_long
9
• QC1DB MEDIAN 0.296 NONE VAL 0.005,0.533 7 qc_eff_median
this |
last_yr |
all
efficiency K-band_low (averaged on bins) 250mas
10
• QC1DB MEDIAN 0.244 NONE VAL 0.015,0.35 4 qc_eff_median
this |
last_yr |
all
efficiency J-band_short
11
• QC1DB MEDIAN 0.198 NONE VAL 0.007,0.395 4 qc_eff_median
this |
last_yr |
all
efficiency K-band_middle
12
• QC1DB MEDIAN 0.192 NONE VAL 0.005,0.351 5 qc_eff_median
this |
last_yr |
all
efficiency K-band_long
*Data sources: QC1DB: QC1 database; LOCAL: local data source
Plot 1 scores: 2 |
data source: eris_ifu_efficiency dataset: qc_eff_median • median: 0.172 NONE fixed thresholds: 0.005...0.279 NONE N_data plotted: 7 [click plot for closeup]
Plot 2 scores: 1 |
data source: eris_ifu_efficiency dataset: qc_eff_median • median: 0.134 NONE fixed thresholds: 0.005...0.312 NONE N_data plotted: 5 [click plot for closeup]
Plot 3 scores: 1 |
data source: eris_ifu_efficiency dataset: qc_eff_median • median: 0.126 NONE fixed thresholds: 0.005...0.314 NONE N_data plotted: 5 [click plot for closeup]
Plot 4 scores: 1 |
data source: eris_ifu_efficiency dataset: qc_eff_median • median: 0.104 NONE fixed thresholds: 0.005...0.211 NONE N_data plotted: 4 [click plot for closeup]
Plot 5 scores: 2 |
data source: eris_ifu_efficiency dataset: qc_eff_median • median: 0.202 NONE fixed thresholds: 0.005...0.437 NONE N_data plotted: 7 [click plot for closeup]
Plot 6 scores: 1 |
data source: eris_ifu_efficiency dataset: qc_eff_median • median: 0.184 NONE fixed thresholds: 0.005...0.387 NONE N_data plotted: 4 [click plot for closeup]
Plot 7 scores: 1 |
data source: eris_ifu_efficiency dataset: qc_eff_median • median: 0.141 NONE fixed thresholds: 0.005...0.389 NONE N_data plotted: 4 [click plot for closeup]
Plot 8 scores: 1 |
data source: eris_ifu_efficiency dataset: qc_eff_median • median: 0.134 NONE fixed thresholds: 0.005...0.277 NONE N_data plotted: 4 [click plot for closeup]
Plot 9 scores: 1 |
data source: eris_ifu_efficiency dataset: qc_eff_median • median: 0.296 NONE fixed thresholds: 0.005...0.533 NONE N_data plotted: 7 [click plot for closeup]
Plot 10 scores: 1 |
data source: eris_ifu_efficiency dataset: qc_eff_median • median: 0.244 NONE fixed thresholds: 0.015...0.35 NONE N_data plotted: 4 [click plot for closeup]
Plot 11 scores: 1 |
data source: eris_ifu_efficiency dataset: qc_eff_median • median: 0.198 NONE fixed thresholds: 0.007...0.395 NONE N_data plotted: 4 [click plot for closeup]
Plot 12 scores: 1 |
data source: eris_ifu_efficiency dataset: qc_eff_median • median: 0.192 NONE fixed thresholds: 0.005...0.351 NONE N_data plotted: 5 [click plot for closeup]
This plot
The EFFICIENCY data are taken every month under clear or photometric conditions with 250mas.
General information
Click on any of the plots to see a close-up version .
The latest date is indicated on top of the plot.
If configured,
data points belonging to the latest date are specially marked statistical averages are indicated by a solid line, and thresholds by broken lines outliers are marked by a red asterisk. They are defined as data points outside the
threshold lines "aliens" (= data points outside the plot Y limits) are marked by a red arrow (↑ ↓ you can download the data for each parameter set if the 'Data downloads' link shows up
