Plot
? |
Symb
? |
Source
* |
Average ? |
Thresholds ? |
N_
data |
QC1
parameter |
Data
downloads |
Remarks |
| method |
value |
unit |
method |
value |
| 1 |
• | QC1DB |
MEDIAN |
|
NONE |
VAL | -1,1 |
0 |
xcorr |
this |
last_yr |
all
|
xcorr, chip 1, WREF=1090.4 |
| 2 |
• | QC1DB |
MEDIAN |
0.9423 |
NONE |
VAL | 0.65,1 |
112 |
xcorr |
this |
last_yr |
all
|
xcorr, chip 2, WREF=1090.4 |
| 3 |
• | QC1DB |
MEDIAN |
0.98538 |
NONE |
VAL | 0.8,1 |
112 |
xcorr |
this |
last_yr |
all
|
xcorr, chip 3, WREF=1090.4 |
| 4 |
• | QC1DB |
MEDIAN |
|
NONE |
VAL | -1,1 |
0 |
xcorr |
this |
last_yr |
all
|
xcorr, chip 4, WREF=1090.4 |
| 5 |
• | QC1DB |
MEDIAN |
0.84093 |
NONE |
VAL | 0.7,1 |
90 |
xcorr |
this |
last_yr |
all
|
xcorr, chip 1, WREF=4092.9 |
| 6 |
• | QC1DB |
MEDIAN |
0.87563 |
NONE |
VAL | 0.7,1 |
90 |
xcorr |
this |
last_yr |
all
|
xcorr, chip 2, WREF=4092.9 |
| 7 |
• | QC1DB |
MEDIAN |
0.82379 |
NONE |
VAL | 0.7,1 |
90 |
xcorr |
this |
last_yr |
all
|
xcorr, chip 3, WREF=4092.9 |
| 8 |
• | QC1DB |
MEDIAN |
0.83967 |
NONE |
VAL | 0.7,1 |
90 |
xcorr |
this |
last_yr |
all
|
xcorr, chip 4, WREF=4092.9 |
| |
|
*Data sources: QC1DB: QC1 database; LOCAL: local text file
|
| Plot 1 | | data source: | crires_wave
(QC1 database) |
| dataset: | xcorr | • |
| median: | no data | NONE |
| fixed thresholds: | -1.0...1.0 | NONE |
| N_data plotted: | 0 |
| [click on plot for closeup] |
| Plot 2 | | data source: | crires_wave
(QC1 database) |
| dataset: | xcorr | • |
| median: | 0.9423 | NONE |
| fixed thresholds: | 0.65...1.0 | NONE |
| N_data plotted: | 112 |
| [click on plot for closeup] |
| Plot 3 | | data source: | crires_wave
(QC1 database) |
| dataset: | xcorr | • |
| median: | 0.98538 | NONE |
| fixed thresholds: | 0.8...1.0 | NONE |
| N_data plotted: | 112 |
| [click on plot for closeup] |
| Plot 4 | | data source: | crires_wave
(QC1 database) |
| dataset: | xcorr | • |
| median: | no data | NONE |
| fixed thresholds: | -1.0...1.0 | NONE |
| N_data plotted: | 0 |
| [click on plot for closeup] |
| Plot 5 | | data source: | crires_wave
(QC1 database) |
| dataset: | xcorr | • |
| median: | 0.84093 | NONE |
| fixed thresholds: | 0.7...1.0 | NONE |
| N_data plotted: | 90 |
| [click on plot for closeup] |
| Plot 6 | | data source: | crires_wave
(QC1 database) |
| dataset: | xcorr | • |
| median: | 0.87563 | NONE |
| fixed thresholds: | 0.7...1.0 | NONE |
| N_data plotted: | 90 |
| [click on plot for closeup] |
| Plot 7 | | data source: | crires_wave
(QC1 database) |
| dataset: | xcorr | • |
| median: | 0.82379 | NONE |
| fixed thresholds: | 0.7...1.0 | NONE |
| N_data plotted: | 90 |
| [click on plot for closeup] |
| Plot 8 | | data source: | crires_wave
(QC1 database) |
| dataset: | xcorr | • |
| median: | 0.83967 | NONE |
| fixed thresholds: | 0.7...1.0 | NONE |
| N_data plotted: | 90 |
| [click on plot for closeup] |
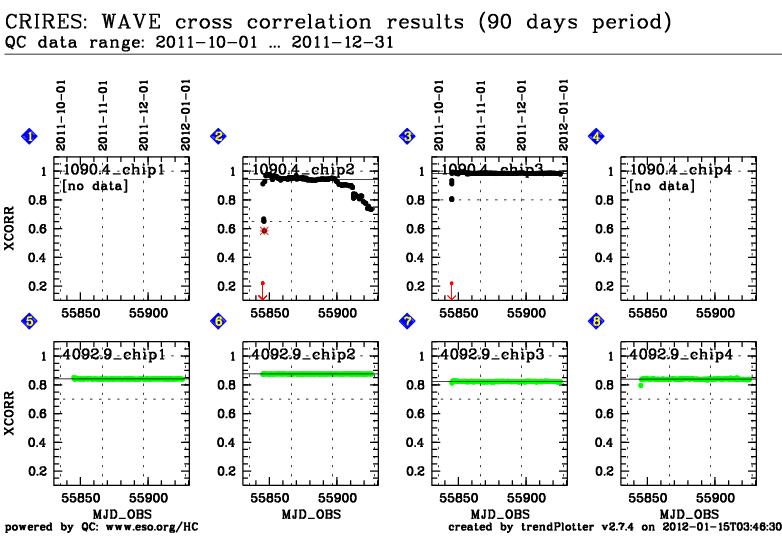
Wavelength calibration: trending of cross correlation results.
The cross correlation result is a unitless number between 0 and 1. Values
above
0.2 are regarded as acceptable. For lower values, the CRIRES
pipeline disregards the result and returns -1. Such values are
marked as "aliens" (red arrows) in the plots.
The cross correlation results are monitored for the two daily health check settings
with reference wavelength (on chip 3) of 1090.4nm using ThAr lamp and 4092.9nm
using N2O absorption cell.
Chips 1 and 4 of the 1090.4 nm setting suffer from vignetting.
Pipeline results are arbitrary and are not plotted.
Pipeline processing in Garching applies dark subtraction and flat-fielding.
General information
Click on any of the plots to see a close-up version.
The latest date is indicated on top of the plot, data points belonging to that date are specially marked.
If configured,
- statistical averages are indicated by a solid line, and thresholds by broken lines
- outliers are marked by a red asterisk. They are defined as data points outside the
threshold lines
- "aliens" (= data points outside the plot Y limits) are marked by a red arrow (↑ or ↓)
- you can download the data for each parameter set if the 'Data downloads' link shows up
|
