Plot
? |
Symb
? |
Source
* |
Average ? |
Thresholds ? |
N_
data |
QC1
parameter |
Data
downloads |
Remarks |
| method |
value |
unit |
method |
value |
| 1 |
• | QC1DB |
MEDIAN |
|
NONE |
3SIG | ± 0.0 |
0 |
dispersion |
this |
last_yr |
all
|
dispersion, chip 1, WREF=1090.4 |
| 2 |
• | QC1DB |
MEDIAN |
5.23719 |
NONE |
VAL | 5.23,5.26 |
113 |
dispersion |
this |
last_yr |
all
|
dispersion, chip 2, WREF=1090.4 |
| 3 |
• | QC1DB |
MEDIAN |
5.0502 |
NONE |
VAL | 5.02,5.07 |
113 |
dispersion |
this |
last_yr |
all
|
dispersion, chip 3, WREF=1090.4 |
| 4 |
• | QC1DB |
MEDIAN |
|
NONE |
3SIG | ± 0.0 |
0 |
dispersion |
this |
last_yr |
all
|
dispersion, chip 4, WREF=1090.4 |
| 5 |
• | QC1DB |
MEDIAN |
19.33052 |
NONE |
VAL | 19.30,19.37 |
86 |
dispersion |
this |
last_yr |
all
|
dispersion, chip 1, WREF=4092.9 |
| 6 |
• | QC1DB |
MEDIAN |
18.53574 |
NONE |
VAL | 18.52,18.575 |
86 |
dispersion |
this |
last_yr |
all
|
dispersion, chip 2, WREF=4092.9 |
| 7 |
• | QC1DB |
MEDIAN |
17.70215 |
NONE |
VAL | 17.69,17.74 |
86 |
dispersion |
this |
last_yr |
all
|
dispersion, chip 3, WREF=4092.9 |
| 8 |
• | QC1DB |
MEDIAN |
16.82039 |
NONE |
VAL | 16.81,16.865 |
86 |
dispersion |
this |
last_yr |
all
|
dispersion, chip 4, WREF=4092.9 |
| |
|
*Data sources: QC1DB: QC1 database; LOCAL: local text file
|
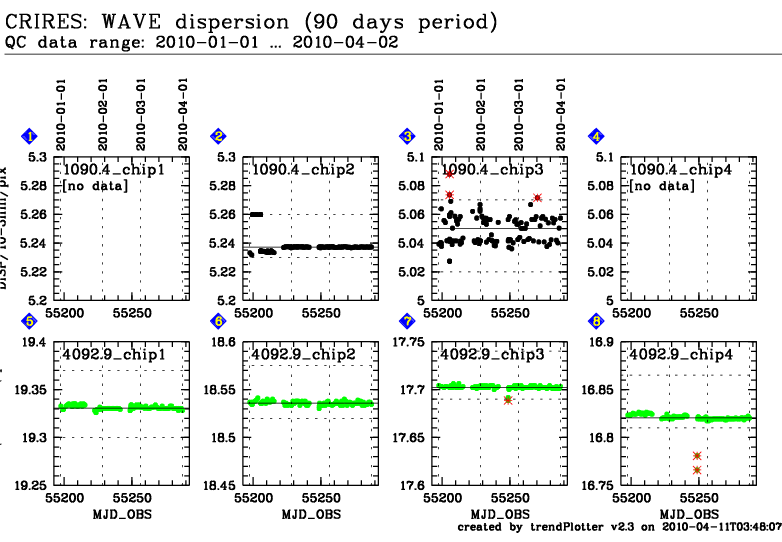
This plot
Wavelength calibration: trending of dispersion (in 10E-3 nm/pixel).
Dispersion is monitored for the two daily health check settings
with reference wavelength (on chip 3) of 1090.4nm using ThAr lamp and 4092.9nm
using N2O absorption cell.
Chips 1 and 4 of the 1090.4 nm setting suffer from vignetting.
Pipeline results are arbitrary and are not plotted.
Pipeline processing in Garching applies dark subtraction and flat-fielding.
This can result in differences for the dispersion. Paranal results for some detectors
are, therefore, omitted.
General information
Click on any of the plots to see a close-up version.
The latest date is indicated on top of the plot, data points belonging to that date are specially marked.
If configured,
- statistical averages are indicated by a solid line, and thresholds by broken lines
- outliers are marked by a red asterisk. They are defined as data points outside the
threshold lines
- "aliens" (= data points outside the plot Y limits) are marked by a red arrow (↑ or ↓)
- you can download the data for each parameter set if the 'Data downloads' link shows up
|
