| This documentation is intended both for QC scientists and SciOps astronomers (who may want to ignore the technical information displayed in grey). | ||||||||||||||||||||||||||||
|
||||||||||||||||||||||||||||
|
||||||||||||||||||||||||||||
| bottom plots | contact | ||||||||||||||||||||||||||||
| NAME | QCsinfo_line.py | |||||||||||||||||||||||||||
| VERSION |
1.0 -- 2006-06-21 fill template by handbook 1.1 -- 2006-07-07 certified 2.0 -- 2009-01-01 completely re-written (from scratch) in Python 3.0 -- 2010-04-13 over-hauled with added QC functions and images (for e.g. images of linearity coefficients cube, gain vs. ADU, and linearity fit) | |||||||||||||||||||||||||||
| SYNTAX | Python | |||||||||||||||||||||||||||
| CALL |
measureQuality from $DFS_PRODUCT/LINE/$DATE: QCsinfo_line.py -a $AB -i 1 | |||||||||||||||||||||||||||
| INSTRUMENT | SINFONI | |||||||||||||||||||||||||||
| RAWTYPE | LINE | |||||||||||||||||||||||||||
| PURPOSE |
a) generates QC report b) writes QC1 parameters into local database | |||||||||||||||||||||||||||
| PROCINPUT |
No input is required: a) $DATE is now read from AB b) primary file is set in QCsinfo_line.py and is the PRO.CATG=BP_COEFF product with the _0000.fits extension. c) The remaining required raw frames are implicitly read from the AB. d) They include products such as BP_COEFF, BP_MAP_NL, LIN_DET_INFO, and GAIN_INFO used and implicitly read. e) Reference BP_COEFF and BP_MAP_NL are read from $DFO_QC_DIR/references/LINE/. | |||||||||||||||||||||||||||
| QC1TABLE |
trending | table(s) in QC1 database: sinfoni_line | |||||||||||||||||||||||||||
| TRENDPLOT |
trending | HealthCheck plot(s) associated to this procedure: trend_report_LINE_gain_HC.html | |||||||||||||||||||||||||||
| QC1PAGE |
trending | associated documentation: line_QC1.html | |||||||||||||||||||||||||||
| QC1PLOTS top |
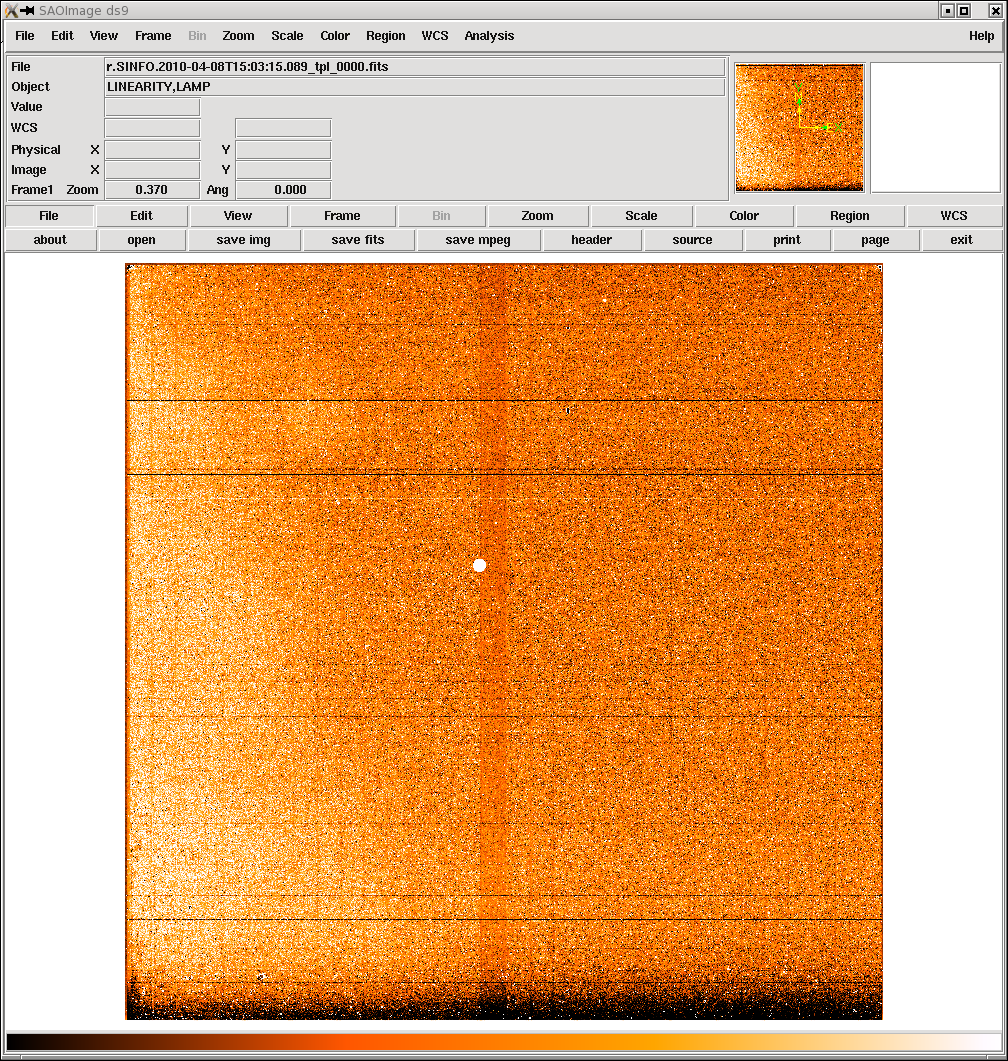
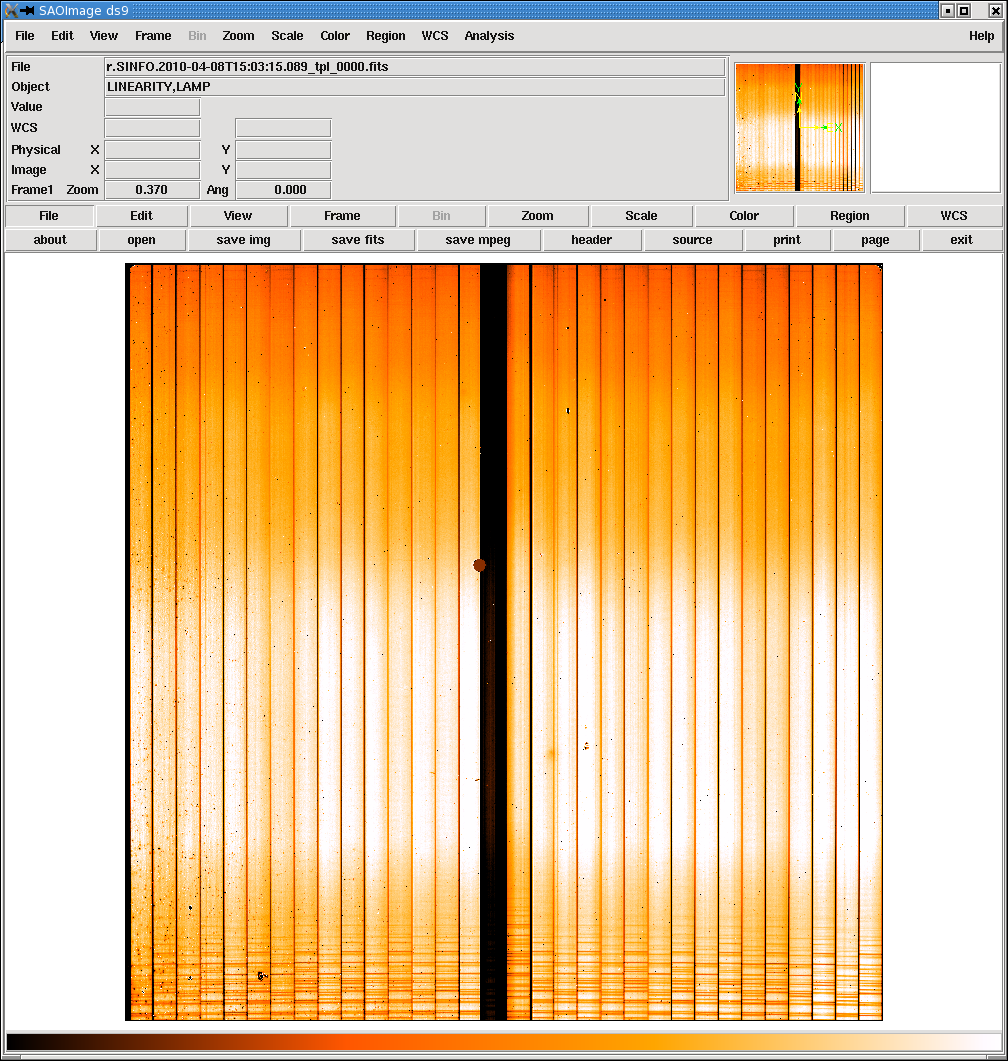
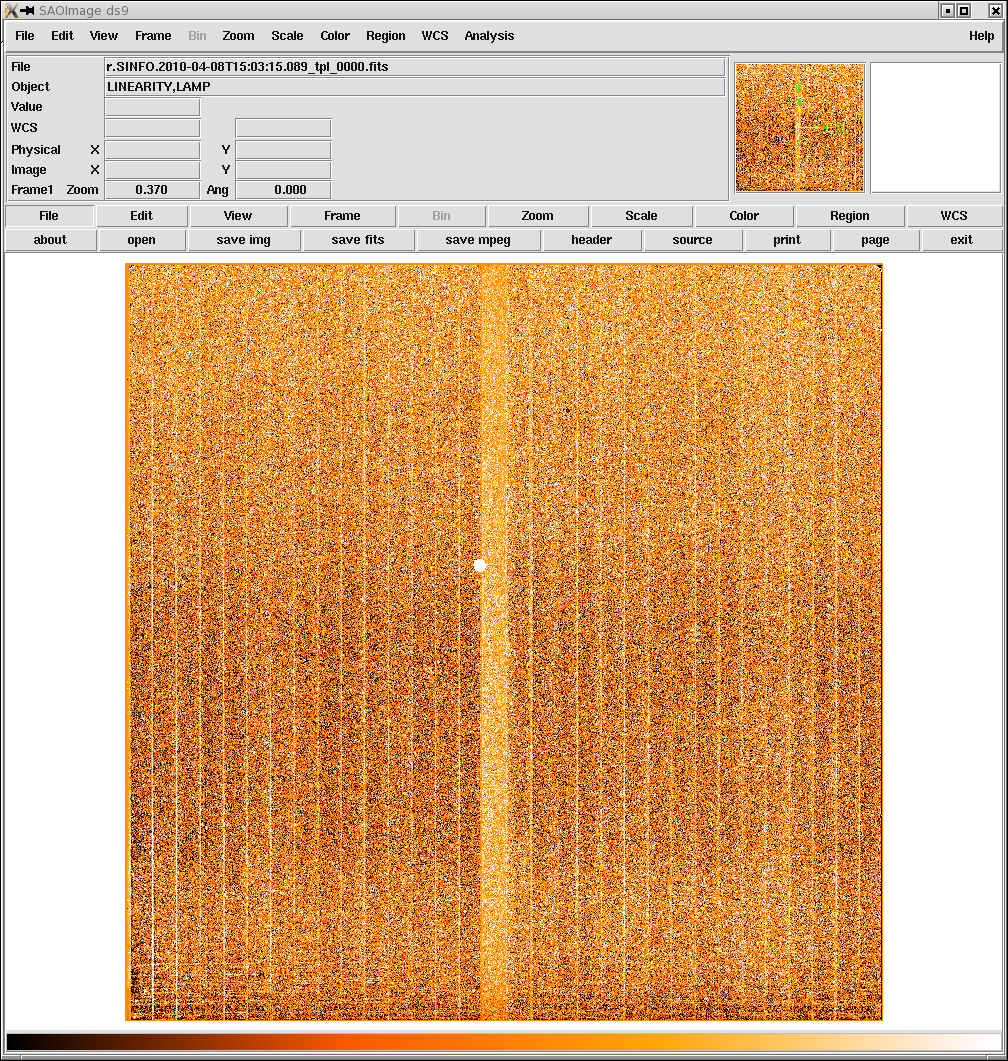
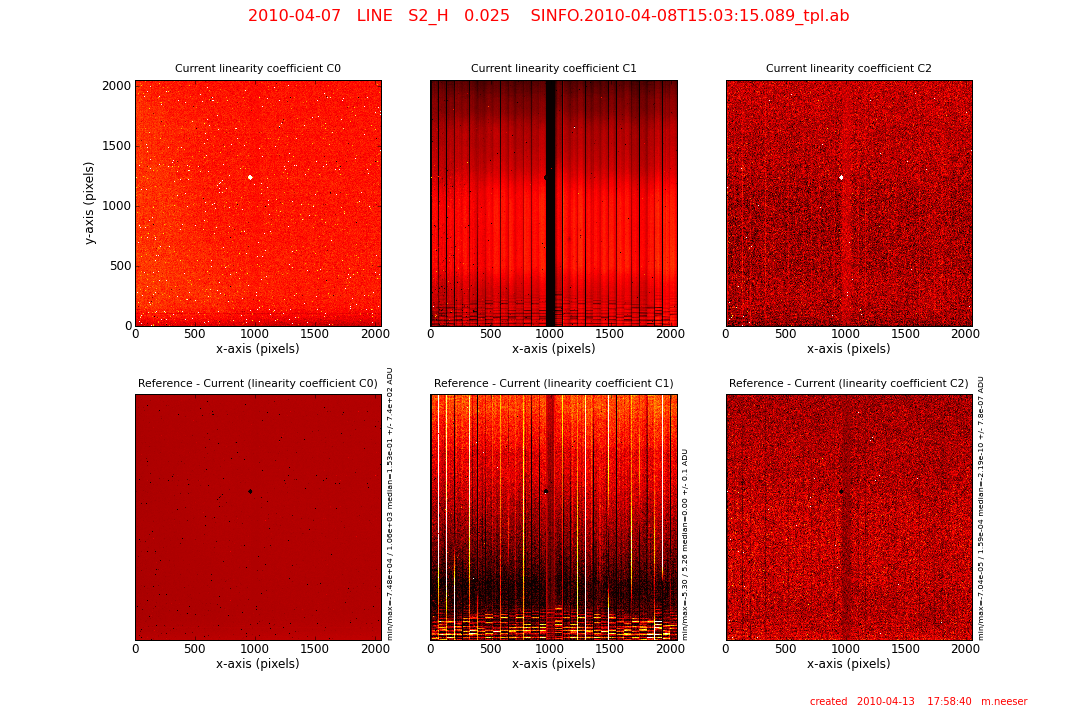
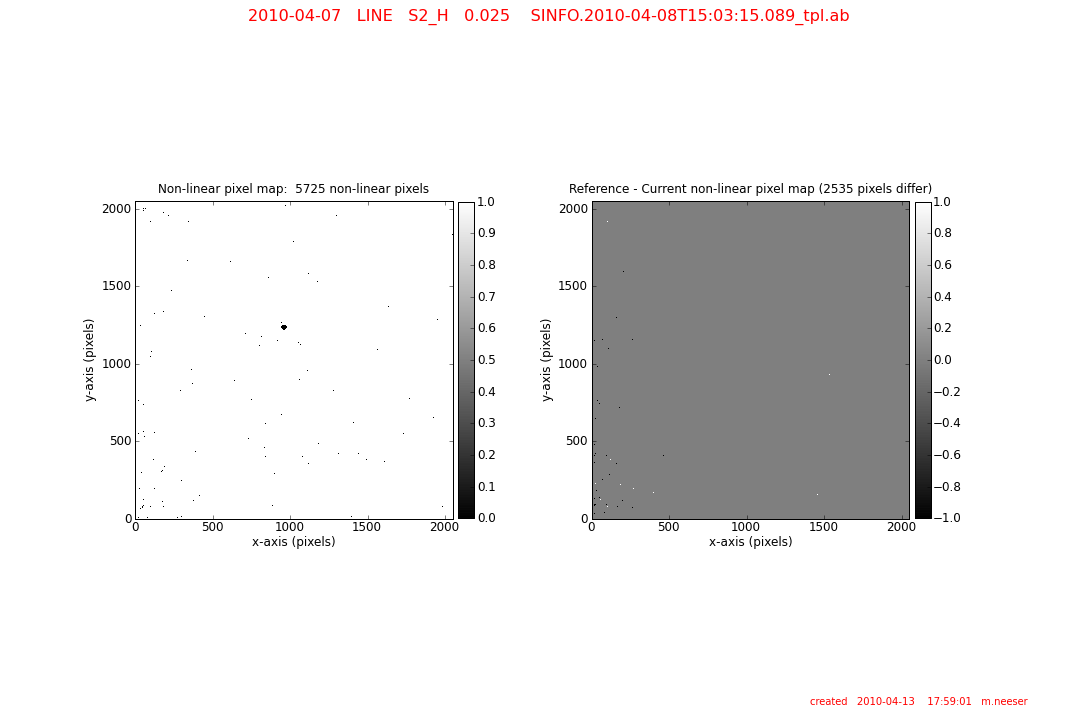
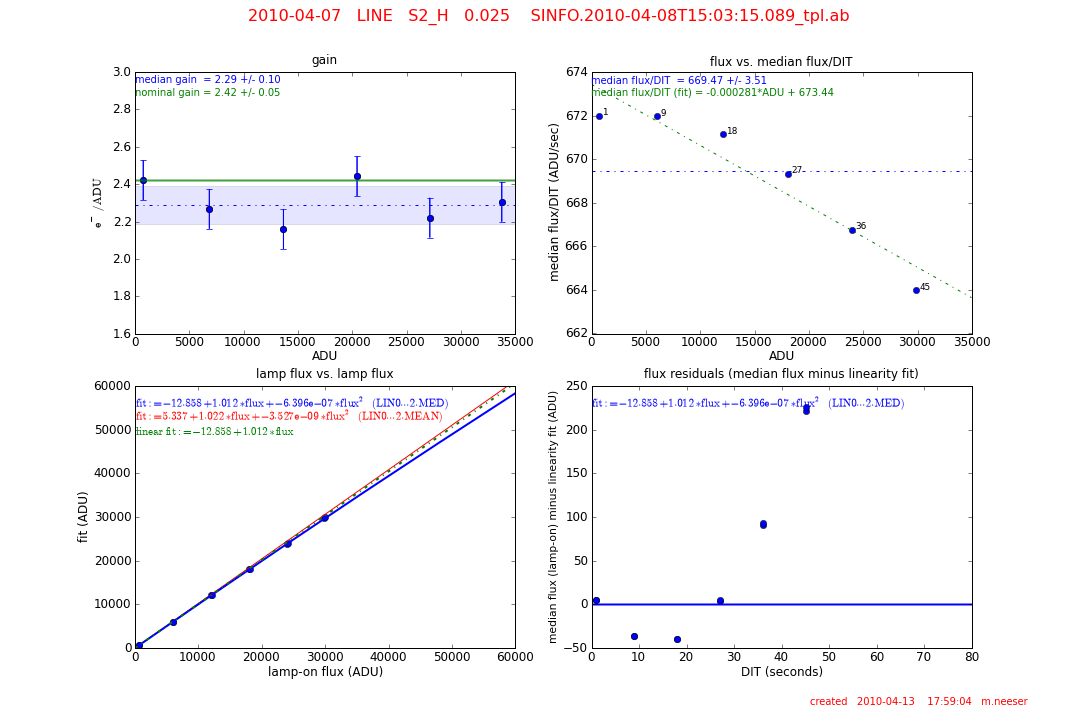
line1.png BP_COEFF is a 2048x2048x3 pixel cube in which each of the three planes is a non-linear polymomial coefficient per pixel. display plane 0 of BP_COEFF (the 3 linearity coefficients) in ds9. The LIN0 coefficient is essentially a DARK. line2.png display plane 1 of BP_COEFF (the 3 linearity coefficients) in ds9. The LIN1 coefficient is essentially a FLAT. line3.png display plane 2 of BP_COEFF (the 3 linearity coefficients) in ds9. The LIN2 coefficient maps the non-linear pixels. line4.png QC Report 1: UL : the current linearity coefficient C0 (BP_COEFF plane 1). UC : the current linearity coefficient C1 (BP_COEFF plane 2). UR : the current linearity coefficient C2 (BP_COEFF plane 3). LL : the difference between the reference and the current coefficient C0 images. The statistics of the difference image (minimum, maximum, median, and standard deviation) are listed to the right of the image. LC : the difference between the reference and the current coefficient C1 images. The statistics of the difference image are listed to the right of the image. LR : the difference between the reference and the current coefficient C2 images. The statistics of the difference image are listed to the right of the image. line5.png QC Report 2: left : a map of the non-linear pixels. Normal pixels are set to 1, while 0 denotes non-linear pixels. right : the difference between the reference and current non-linear pixel maps. line6.png QC Report 3: UL: the gain (e-/ADU) as a function of linearity lamp flux level (ADU). The nominal gain (SINFONI User's manual pg. 44) is shown as a green line. The median gain and its standard deviation is shown as a dotted blue line and a shaded blue area, respectively. UR: the median flux per DIT (ADU/sec) is shown as a function of linearity lamp flux level (ADU). Each point is labelled with its DIT value. The median flux/DIT is shown as a dotted blue line. A linear fit to this relation is shown as a green dotted line. LL: the lamp-on flux vs. the linearity fit. The fit using median value terms (LIN0.MED, LIN1.MED, and LIN2.MED) is shown in blue. The fit using mean value terms (LIN0.MEAN, LIN1.MEAN, and LIN2.MEAN) is shown in red. A linear fit using the median values is plotted using a dotted green line. LR: fit residuals as a function of DIT (seconds). The full linearity fit (with the median coefficients) is subtracted from the median lamp-on flux. | |||||||||||||||||||||||||||
| QC1PARAM |
QC1 parameters written into QC1 table (sinfoni_line):SOURCE(header or script) DBNAME value description | |||||||||||||||||||||||||||
| ALGORITHM |
Description of algorithms: qc_bpm_lin0_mean: Each DIT in a linearity series is made up of four frames (two lamp-on and two lamp-off frames). The median of each image is computed and the lamp-on and lamp-off frames are subtracted: med_dit(i) = [median(F(i)_on) - median(F(i)_off)]/DIT The mean of all N med_diti is computed as: med_dit = Sum[med_dit(i)/N] Finally, a parabolic fit of the product of (DIT(i) * mean), as a function of med_dit(i)i, is made with the coefficients C0, C1, and C2. qc_bpm_lin1_mean: as above qc_bpm_lin2_mean: as above qc_bpm_lin3_mean: as above qc_bpm_lin4_mean: as above qc_bpm_nbadpix: For each pixel a median flux level as a function of DIT is known and is compared to a linear fit. Those pixels that diverge from the linear fit by a given threshold are flagged as non-linear. The non-linear bad pixel map (BAD_MAP_NL) is combined with the hot and cold pixel maps to create a master bad pixel map (MASTER_BP_MAP). qc_bpm_lin0_med: as for the qc_bpm_lin0_mean above, but with a median of the coefficients. qc_bpm_lin1_med: as for the qc_bpm_lin1_mean above, but with a median of the coefficients. qc_bpm_lin2_med: as for the qc_bpm_lin2_mean above, but with a median of the coefficients. qc_bpm_lin3_med: as for the qc_bpm_lin3_mean above, but with a median of the coefficients. qc_bpm_lin4_med: as for the qc_bpm_lin4_mean above, but with a median of the coefficients. qc_gain: Pairs of consecutive lamp-on flats (F1_on and F2_on) and lamp-off flats (F1_off and F2_off) are selected from the input data frames and their differences are computed: diff_on = F1_on - F2_on and diff_off = F1_off - F2_off. The mean of each frame (F1_on, F1_off, . . . ) and the standard deviation of the differences sigma(diff_on) and sigma(diff_off) are computed. The gain is then given by: gain = [(F1_on and F2_on) - (F1_off and F2_off)]/[sigma(diff_on)^2 - sigma(diff_off)^2]. | |||||||||||||||||||||||||||
| CERTIF |
Reasons for rejection: The overall lamp intensity of the flat used to make the linearities has sometimes been set too high (> 40, 000 counts), with the result that an excessive number of pixels enter the non-linear range. If the fit deduced for the non-linearity is a very poor match to the data. | |||||||||||||||||||||||||||
| COMMENTS | ||||||||||||||||||||||||||||
| top | [2015-10-30T08:20:47] created by qcDocu v1.1.2, a tqs tool | |||||||||||||||||||||||||||