3D slice of the z=2 universe: Aims, methods, visions and strategies


The NOT slice of the z=2 universe: Scientific aims


1. The Lyman alpha emission line as a survey tool

Availabily of 8-10m class telescopes has finally confirmed the longstanding prediction that Lyman alpha in emission would prove to be a powerful tool for identification of high redshift objects, and hence for the study of formation of large scale structures (e.g. Patridge and Peebles 1967).

Several surveys for Lyman alpha selected objects are now underway; LALA (the Large Area Lyman Alpha survey), CFH12K medium band imaging (Stiavelli et al. 2001), the ESO Large Programme on selected fields of Radio Galaxies (Venemans et al. 2002), the ``Subaru deep field'' (Ouchi et al. 2002), imaging of Gamma Ray Burster fields and host galaxies in Lyman alpha (Fynbo et al. 2002) and the ``VLT Building-the-Bridge survey'' (Fynbo et al. in prep).


Patridge and Peebles 1967, ApJ, 147, 868


LALA: Rhoads et al. 2000, ApJL 545, 85
Stiavelli et al., 2001, ApJL 561, L37
Venemans et al. 2002, ApJL 569, L11
Ouchi et al. 2002, astro-ph/0202204
Fynbo, Møller, Thomsen, Hjorth et al. 2002, astro-ph/0203245


2. Why is Lyman alpha selection better?

Two effects work together to make Lyman alpha selection (as opposed to surveys based on continuum flux selection) particularly useful for high redshift surveys. (1) Because the line is predicted to have extremely large equivalent width (Valls-Gabaud 1993, Charlot & Fall 1993), it is possible to identify objects which are far below the detection limit of broad band surveys e.g. surveys based on the Lyman Break technique (Steidel and Hamilton 1992), and (2) as soon as a candidate Lyman alpha emitter has been confirmed spectroscopically its redshift is also known with high accuracy.

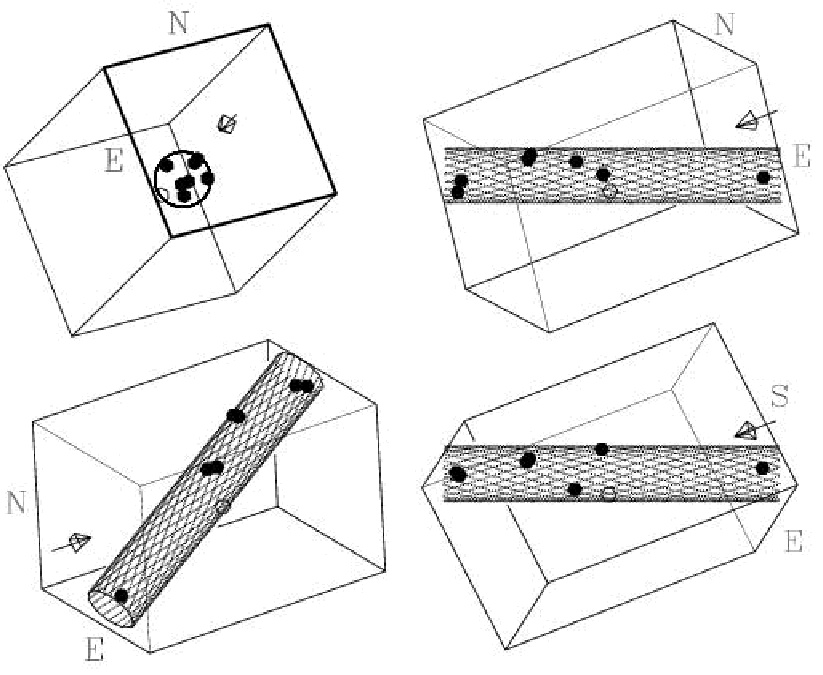
The volume density of faint galaxies is much higher than the volume density of the much brighter Lyman Break galaxies (LBGs), and faint Lyman alpha selected galaxies can therefore very effectively be used to map out structures in the early universe. The high volume density and precise redshifts make it possible to easily produce 3D maps of filaments and other structures in the high redshift universe. To the right is shown an example of a filament at z=3 mapped by eight Lyman alpha emitters and viewed from several different perspectives (from Møller and Fynbo, 2001).

The typical Lyman alpha selected high redshift object is much fainter, smaller, and less massive than todays fully formed galaxies ( Fynbo, Møller and Thomsen, 2001). In numerical simulations of the early universe such low mass clumps are seen to attract each other, to collide, and finally to merge to build up larger and larger galaxies. Typical high redshift Lyman alpha emitters can therefore be seen as the elemental ``galaxy building blocks'' and we often refer to them as ``LEGOs''.


Valls-Gabaud, D., 1993, ApJ, 419, 7
Charlot, S., & Fall, S.M., 1993, ApJ, 415, 580

Steidel and Hamilton, 1992, AJ, 104, 941


Møller and Fynbo, 2001, A&A, 372, L57

Fynbo, Møller and Thomsen, 2001, A&A, 374, 443
LEGO: Lyman alpha Emitting Galaxy-building Object


3. Scientific aims

The goal of this project is to collate a catalogue of 100 - 200 z=2 LEGOs. With this catalogue we shall be able to address the list of issues given below, which make up the primary aims of the project.


(1) The faint galaxy population at z=2
Most of the current surveys are aiming at redshifts in the range 3-5. The NOT survey is unique in being the only Lyman alpha survey targetting z=2 LEGOs. With a large sample of confirmed LEGOs we shall be able to characterise this class of objects at z=2, and matching the sample up with broad band selected (flux limited) samples at similar redshifts we shall be able to extend the galaxy luminosity function (LF) at z=2 to much fainter magnitudes. Similar work at higher redshifts is in progress on the VLT and other large telescopes, so a direct comparison to samples at higher redshifts shall soon be possible, allowing us to study the redshift evolution of the LEGO population, and the evolution of the faint end LF in general.


(2) Structure formation and ``The Cosmic Web''
The large volume density of the LEGOs, and the precise redshifts of the Lyman alpha emission lines, allow us to create detailed redshift-space maps of their distribution. Such maps will visualise directly the large scale structures (voids, walls, filaments) predicted to have been formed at z=2. Such maps will provide both a critical test of the current Lambda-CDM structure formation paradigm, and information on local (environment dependent) biasing of the star formation rates.


Lambda-CDM:
Models of the universe dominated by ``Cold Dark Matter'' and a non-zero cosmological constant.


(3) The filament cosmology test
A very exiting additional goal is to perform a new cosmological test for the value of Einsteins Cosmological Constant (Omega-Lambda). The test (described in Møller and Fynbo, 2001) is based on the statistical distribution of filament inclination angles in a large volume:
    The conversion of the observed volume into proper coordinates depends on the chosen cosmological model. The effect of using a non-zero Lambda is to significantly stretch the volume along the sightline, thereby causing the angular distribution of filament orientations to be non-isotropic.
Determining Omega-Lambda accurately this way is a long term goal which will require more than one volume to be mapped. A detailed study of the accuracy of this method, and an analysis of possible systematic errors is in progress. The figure to the right (our simulations compared against the high-z supernova results) is taken from the first paper of that study (Weidinger et al. 2002).


Møller and Fynbo, 2001, A&A, 372, L57
Weidinger et al., 2002, A&A, in print, astro-ph/0205425


4. Identification and confirmation technique


Candidate LEGO selection

We select candidate Lyman alpha emitters using a combination of three filters; one narrow band filter centred at the wavelength of Lyman alpha at the target redshift and two broad band filters. One of the broad band filters is always chosen to cover the wavelength of the narrow filter (the ``on-band-broad'' filter), the other is chosen so that it does not (``off-band-broad'' filter).

In a (narrow minus on-band-broad) vs. (narrow minus off-band-broad) colour-colour diagram (see figure to the right) we then obtain a 2D separation of all objects, where pure continuum objects are confined to a narrow locus with blue objects at one end of the locus and red objects at the other end. Objects with emission (or absorption) lines in the narrow filter will then separate away from the locus of the continuum sources along the diagonal. Details on the use of this technique can be found in Møller and Warren 1993; Fynbo, Møller and Warren 1999; and Fynbo et al. 2002.

For this project we use a 48 Ångstrøm narrow filter centred at 3701 Ångstrøm, the on-band-broad filter is a U-band filter and the off-band-broad filter is an R-band filter. We define as candidates objects that are detected at more than 5 sigma significance in the narrow band image and whose narrow minus U colour is below -0.7 mag (see Fynbo et al. 2002).


Møller and Warren, 1993, A&A, 270, 43
Fynbo, Møller and Warren, 1999, MNRAS, 305, 849
Fynbo, Møller, Thomsen, Hjorth et al. 2002, astro-ph/0203245


Spectroscopic confirmation
For the spectroscopic follow-up we use Multi-Object spectroscopy. Spectroscopic follow-up is mandatory for Lyman alpha imaging surveys, and will in general have the following aims:

- to confirm the emission line nature of the candidates and to
measure the precise wavelengths of the emission lines,

- to measure the spectroscopic flux of the emission line, this is an
important check because the line may be close to the edge of the
narrow band filter where the filter transmission is low,

- to measure (or place a lower limit on) the velocity width of
the emission lines, and

- to identify (and exclude) low redshift interlopers.

The last point can be rather tricky for z>2 LEGO surveys (see e.g. Fynbo, Møller and Thomsen, 2001) and much additional telescope time is needed in order to address it properly. An added advantage of conducting the survey at z=2 is that the target wavelength is 3701 Ångstrøm. This has the effect that we will have no interlopers due to foreground emission line galaxies, because both OII(3727 Å) and OIII(5007 Ångstrøm) emitters already are on the long wavelength side of the filter, and therefore cannot be redshiftet into its transmission window.


Fynbo, Møller and Thomsen, 2001, A&A, 374, 443


5. Optimized observing strategy

As detailed above there are three good reasons to work at z=2:

- astrophysically interesting redshift domaine not targeted by other
surveys
- low surface brightness dimming
- no line identification confusion

and the NOT/ALFOSC combination is perfectly suited to work at this redshift. Nevertheless the atmospheric absorption at 3701 Ångstrøm grows rapidly with airmass and for the optimal use of any given dark night one should in general not be observing the same field throughout the night. For this reason we have selected three fields. The field coordinates were carefully chosen considering three criteria:

1) very low galactic reddning
2) declination chosen to keep the field at low airmass for 6-7 hours
each nigh (as seen from the NOT)
3) separated by roughly 7 hours in RA

This careful field selection ensures that for 7-8 months each year we will be able to make full and optimal use of each dark minute. The central field is our ``primary field'' and our goal is to complete a mosaic of 3x2 pointings in this field. The two flanking fields (at +/-7 hours) are only observed when the primary field is at too high airmass.


Visibility plots :
January, March, May, July, September, November


6. The fields


Field 0010 - pointing 0010a - RA(2000) 00 10 35, Dec(2000) 24 57 00
Field 0010 - pointing 0010b - RA(2000) 00 10 35, Dec(2000) 25 02 00
Field 0010 - pointing 0010c - RA(2000) 00 10 13, Dec(2000) 24 57 00
Field 0010 - pointing 0010d - RA(2000) 00 10 13, Dec(2000) 25 02 00

Field 0010 combined

Field 0010 pnts a, b, c, and d


Field 0726 - pointing 0726a - RA(2000) 07 26 35, Dec(2000) 35 03 35
Field 0726 - pointing 0726b - RA(2000) 07 26 35, Dec(2000) 34 58 35
Field 0726 - pointing 0726c - RA(2000) 07 27 00, Dec(2000) 35 03 35
Field 0726 - pointing 0726d - RA(2000) 07 27 00, Dec(2000) 34 58 35

Field 0726 combined

Field 0726 pnts a, b, c, and d


Imaging of each pointing follows this dither pattern.


GRB000926 - pointing a - RA(2000) 17 04 10, Dec(2000) 51 47 10
GRB000301C - pointing a - RA(2000) 16 20 19, Dec(2000) 29 26 36
GRB000301C - pointing b - RA(2000) 16 20 19, Dec(2000) 29 21 36


Work in progress / More field images will be added soon.

Palle Møller - pmoller[at]eso.org
Last updated: 3 October 2002