Effect of scintillation on data quality
Scintillation, atmospheric or induced by fiber injection fluctuations,
causes fluctuating imbalance between the beam intensities.
I test the effect this has on the SNR and bias of the squared visibilities.
For this purpose I have simulated frames of 4 phase bins,
with Poisson noise added, from which I derive visibilities in two ways.
First, the "Mark III" method, using V^2=<X^2+Y^2-N>/<N>^2,
and second, the "AMBER" method of computing the squared visibility for
each frame, correcting it by the beam intensity imbalance, and then averaging.
Note that the Mark III estimator averages nominator and denominator separately
before division, which makes this estimator also immune agains scintillation
if the integration time is longer than the typical scintillation time
scale, as claimed by D. Mozurkewich.
We use measurements of the injected flux by FINITO obtained by H. Bonnet on 2006-09-30, which was sampled at 2000 Hz.
We averaged 12 samples together to match one bin in a 24 ms coherent sample.
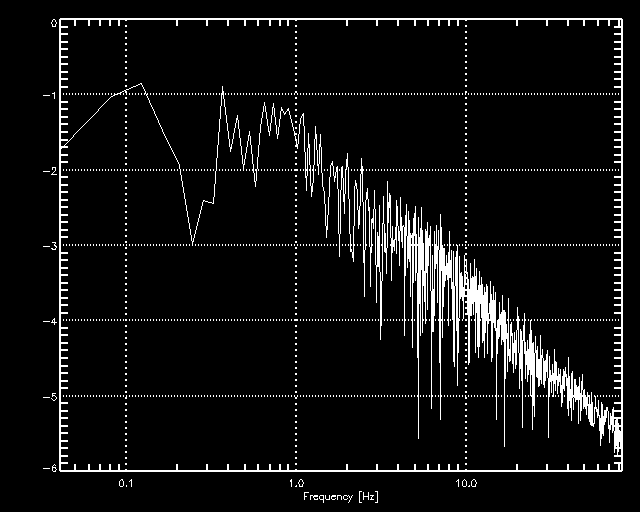
In the Figure below, on the left we show in three panels the intensity in beam 1 and 2, and the visibility reduction
factor 2*sqrt(I1I2)/(I1+I2), respectively. The data are plotted versus
consecutive bin numbers, with 4 bins constituting a frame. On the right, we show the power spectrum of I1.
| 24 ms coherent int. time | |
|---|
 |  |
|---|
We repeated the simulation with different count rates and
the little table below shows that at low photon count rates, the ``AMBER'' estimator is biased.
It also shows that the Mark III estimator (averaging over 100 frames) is unaffected by the
scintillation.
Counts     V^2
per frame  M3   sigma AMBER sigma
 5         1.00 0.029 0.88 0.028
10         0.98 0.015 0.91 0.019
20         0.99 0.011 0.97 0.013
40         1.00 0.008 0.99 0.009
We also used theoretical power spectra of scintillation, and show below that the Mark III estimator only fails
if just a few samples are averaged, instead of a sufficient number to cancel the effect of scintillation
| 24 ms coherent int. time | |
|---|
 |  |
|---|
Samples     V^2
per average M3   sigma    AMBER sigma
  5         0.95 0.006    0.98 0.006
 10         0.95 0.006    0.97 0.006
 50         0.96 0.007    0.97 0.005
100         0.98 0.008    0.98 0.006


