EEV 44-82 -1-A57
CCD name : Circinus
Serial number :
9253-13-02
Type : Backside, Single layer AR Pixel size 15x15 µm
Number of photosensitive pixels 2048 x 4102 [HxV]
Number of
outputs : 2
Overall rating :
Measurement made by Boris Gaillard the: 23 28 May 2001
Data
reduced by Boris Gaillard and Fabrice Christen the: 05 June 2001
Clock mode: 225kpx/rr/HG/512
Conversion Factor=   0.56348e-/ADU ±0.001367     for 20699.4ADU
RMS noise        =   3.8613e-      ±0.1704

CCD temperature : -120.0Cº


Window area is : X1= 2219 X2= 4232 Y1= 15 Y2= 496
Bandwidth 5nm

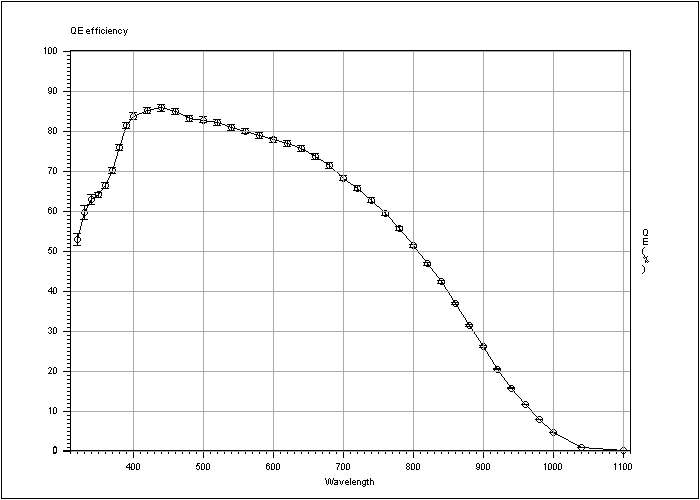
Wav.       QE%                   PRNU rms%       Phase=
320        52.7     ±1.5         3.78            6.758838
330        59.4     ±1.7         3.63            6.716986
340        62.8     ±1.2         3.56            6.697626
350        63.9     ±0.63        3.62            6.71402
360        66.3     ±0.66        3.6             6.710535
370        70       ±0.69        3.21            6.599636
380        75.9     ±0.75        2.42            6.321756
390        81.2     ±0.83        1.89            6.076339
400        83.6     ±0.85        1.59            5.904734
420        85       ±0.86        1.33            5.727224
440        85.7     ±0.86        1.29            5.697629
460        84.7     ±0.85        1.13            5.556611
480        83       ±0.83        1.29            5.691469
500        82.5     ±0.89        1.22            5.639693
520        82       ±0.82        1.09            5.518802
540        80.7     ±0.81        1.25            5.663516
560        79.8     ±0.59        1.13            5.563032
580        78.8     ±0.79        1.27            5.680919
600        77.7     ±0.64        1.16            5.589927
620        76.7     ±0.75        1.25            5.665014
640        75.6     ±0.74        1.02            5.457629
660        73.6     ±0.71        1.06            5.497646
680        71.2     ±0.68        1.11            5.541661
700        68.1     ±0.64        1.15            5.584154
720        65.6     ±0.6         1.18            5.602041
740        62.6     ±0.57        1.42            5.798764
760        59.2     ±0.53        1.24            5.649753
780        55.6     ±0.49        1.36            5.752489
800        51.1     ±0.44        1.57            5.899591
820        46.7     ±0.4         1.57            5.896596
840        42.2     ±0.35        1.47            5.821398
860        36.8     ±0.31        1.32            5.718015
880        31.3     ±0.25        1.67            5.950236
900        25.9     ±0.21        2.07            6.178489
920        20.3     ±0.16        2.85            6.448373
940        15.6     ±0.12        4.2             6.802537
960        11.5     ±0.088       5.21            6.986774
980        7.71     ±0.058       6.4             7.142319
1000       4.52     ±0.034       7.64            7.281916
1040       0.805    ±0.006       8.43            7.4466
1100       0.0914   ±0.00068     11.9            7.862381
Table 1: Measurement of the Quantum Efficiency.
Figure 1: Graphic representation of the QE.
Figure 2: Graphic representation of the PRNU.
In this section you can compare the QE we measured with the testbench and
QE Minimum specification
Typical QE
QE from Marconi
|
|
|
|---|---|
Figure 3: Comparison between the QE measured by ESO, the QE measured by Marconi, ESO specification and minimum specification. |
Figure 4: Ratio between the ESO measurements and the ESO minimum specification. |
|
Comparison QE ESO / QE Marconi |
|||||
|
Wavelength (nm) |
QE ESO (%) |
QE Marconi (%) |
Difference (Eso - Marc. %) |
Relative difference (Marconi as reference %) |
Ratio QE ESO Canis Minor / QE Marconi |
|
350 |
63.9 |
61.4 |
2.5 |
4.1 |
1.04 |
|
|
83.6 |
84 |
-0.4 |
-0.5 |
1 |
|
500 |
82.5 |
81.4 |
1.1 |
1.4 |
1.01 |
|
650 |
74.6 |
73 |
1.6 |
2.2 |
1.02 |
|
900 |
25.9 |
27.1 |
-1.2 |
-4.4 |
0.96 |
Table 2: Difference and relative difference between ESO measurements and Marconi.
|
|
|
|---|---|
Figure 6: Graphic representation of the difference and the relative difference. |
Figure 7: Ratio between the ESO measurements and the Marconi measurements |
For the flat field we use three wavelengths, 350nm, 600nm and 900nm. For each wavelength we make two images, high level (45000 ADU) and low level (1000 ADU).
350nm (UV), bandwidth 5nm |
600nm, bandwidth 5nm |
900nm, bandwidth 5nm |
|||
High level |
Low level |
High level |
Low level |
High level |
Low level |
Table 3: Flat field for three wavelengths.
The time exposure, for the long dark exposure, is 3600 seconds.
Table 4: Bias and dark.
Left readout port
Clock mode: 225kpx/rlrl/HG/512
Conversion Factor=   0.56839e-/ADU ±0.002489     for 20231.7ADU
RMS noise        =   4.5071e-      ±0.4465

right readout port
Clock mode: 225kpx/rr/HG/512
Conversion Factor=   0.56596e-/ADU ±0.001808     for 19794.3ADU
RMS noise        =   4.6345e-      ±0.3434

Left readout port
Clock mode: 50kpx/rlrl/HG/512
Conversion Factor=   0.61558e-/ADU ±0.002689     for 19696.1ADU
RMS noise        =   2.9649e-      ±0.336

Right readout port
Clock mode: 50kpx/rlrl/HG/512
Conversion Factor=   0.61461e-/ADU ±0.00252      for 19638.3ADU
RMS noise        =   2.2884e-      ±0.115
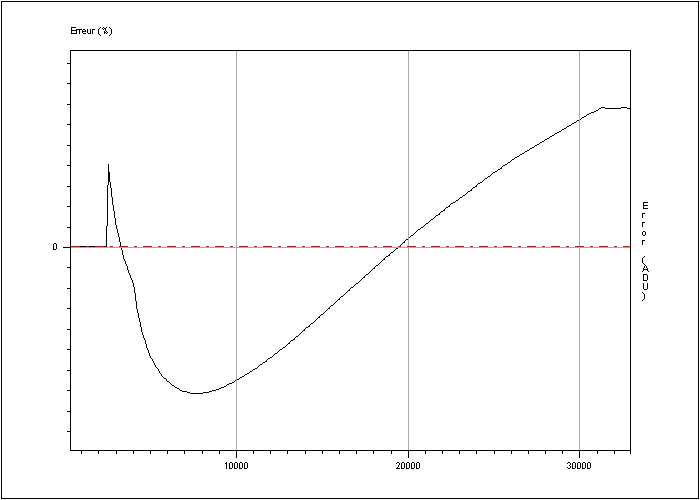
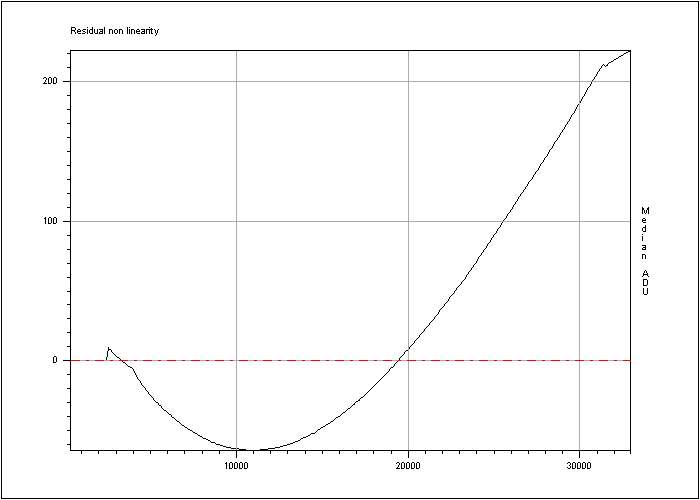
RMS non linearity (%)         =    0.5
Peak to peak non linearity (%)=    1.4

Figure 5: Error of linearity

Figure 6: Residual non linearity.
Exposure time (s) = 3600
Dark current : 0.44 ± 0.02 ADU/hour/pixel
Dark current : 0.24 ± 0.01 e-/hour/pixel
High level (Around 25000 ADU)
Horizontal CTE = 0.999996
Vertical CTE   = 0.9999996
In this section we expose the hot pixel, the dark pixel, the trap and the very large trap we found.
A hot pixel provides a signal of > 60 e- / pixel / hour.
Result: 11 hot points.
|
Position |
|
X= |
Y= |
185 1751 242 188 1854 1911 933 1913 1913 1913 1913 |
2074 2193 2238 2611 3729 3729 3743 4022 4025 4026 4027 |
Total hot pixel: 11 |
|
Table 5: Position and images of the hot pixels.
A dark pixel is one with 50% or less than the average output for uniform intensity light level, measured with a flat field level around 500 photo-electrons.
Result: 0 dark pixels detected.
|
Position |
|
|
Total hot pixel: 0 |
Table6: Position and images of the dark pixels.
A trap is defined as a pixel that captures more than 10 electrons, measured with a flat field level around 500 photo-electrons.
Result: Not available
A very large trap is defined as a pixel that captures more than 10 000 electrons, measured with a flat field level around 90% of full well capability.
Result: Not available.
A bad column is 10 or more contiguous hot or dark pixels in a single column or a very bright pixel or a very large trap.
Result: 2 bad columns.
|
Position Image |
X= 1944, Y= 925 X= 1942, Y= 925 |
Total hot pixel: 2 |
Table 7: Position and images of the bad columns. The values in the table are in ADU. Conversion factor: 1.1 e-/ADU
Here is a summary of cosmetic defects:
|
|
Hot pixel |
Dark pixel |
A very bright pixel (a) |
Trap |
Very large trap (b) |
Sup. 10 contiguous pixels (c) |
Total bad column (a+b+c) |
|---|---|---|---|---|---|---|---|
|
ESO |
11 |
0 |
/ |
/ |
/ |
2 |
2 |
|
Marconi |
19 |
10 |
2 |
0 |
0 |
10 |
|
Table 8: Summary of cosmetic defects.
Be careful, in the ESO test report we didn't include the very large trap in the total bad column because for this ccd we couldn't measure this parameter.
Back to the overview page ESO Test Reports for the OmegaCAM CCDs