EEV 44-82 -1-A57
CCD name : Caelum
Serial number :
9314-11-02
Type : Backside, Single layer AR Pixel size 15x15 µm
Number of photosensitive pixels 2048 x 4102 [HxV]
Number of
outputs : 2
Overall rating :
Test date : Tuesday January 9 2001
Clock mode: EEV 1p/225k/HG 512
Conversion Factor=   1.0239e-/ADU  ±0.002837     for 24310.6ADU
RMS noise        =   6.8971e-      ±0.05924

CCD temperature : -120.2Cº


Window area is : X1= 67 X2= 2095 Y1= 3 Y2= 506
Bandwidth 5nm

Wav.       QE%                   PRNU rms%       Phase=
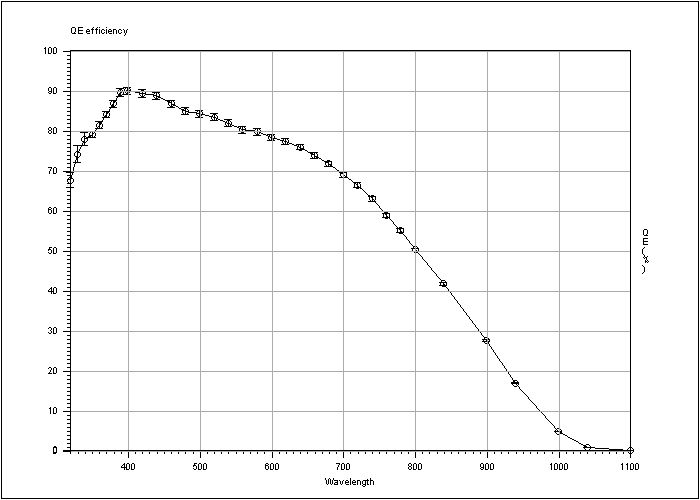
320        67.6     ±1.9         3.1             6.990278
330        74.1     ±2.1         2.95            6.919618
340        77.9     ±1.5         2.88            6.883078
350        79       ±0.77        2.89            6.89571
360        81.3     ±0.8         2.92            6.914473
370        84       ±0.83        2.71            6.820794
380        86.7     ±0.86        2.27            6.592894
390        89.5     ±0.92        1.98            6.393495
400        89.9     ±0.91        1.8             6.24148
420        89.3     ±0.9         1.65            6.075473
440        88.6     ±0.89        1.6             6.016897
460        86.7     ±0.87        1.54            5.94352
480        84.8     ±0.85        1.49            5.899476
500        84.2     ±0.84        1.46            5.904783
520        83.3     ±0.84        1.41            5.880594
540        81.9     ±0.82        1.36            5.873096
560        80.2     ±0.8         1.32            5.9017
580        79.6     ±0.8         1.26            5.875542
600        78.3     ±0.78        1.21            5.876471
620        77.2     ±0.76        1.18            5.895203
640        75.9     ±0.74        1.16            5.932156
660        73.7     ±0.71        1.16            5.972717
680        71.7     ±0.68        1.18            6.04047
700        68.9     ±0.64        1.22            6.106016
720        66.3     ±0.61        1.34            6.232331
740        62.9     ±0.57        1.53            6.376133
760        58.7     ±0.53        1.53            6.385189
780        54.9     ±0.48        1.6             6.424183
800        50.2     ±0.43        1.69            6.501359
840        41.6     ±0.35        1.81            6.581016
900        27.5     ±0.22        2.22            6.798418
940        16.8     ±0.13        4.63            7.500237
1000       4.76     ±0.036       8.3             8.030088
1040       0.828    ±0.0062      8.41            8.05547
1100       0.108    ±0.0008      10.6            8.326909
Table 1: Measurement of the Quantum Efficiency.
Figure 1: Graphic representation of the QE.
Figure 2: Graphic representation of the PRNU.
In this section you can compare the QE we measured with the testbench and
QE Minimum specification
Typical QE
QE from Marconi
Figure 3: Comparison between the QE measured by ESO, the QE measured by Marconi,
ESO specification and minimum specification.
|
Comparison QE ESO / QE Marconi |
||||
|
Wavelength (nm) |
QE ESO (%) |
QE Marconi (%) |
Difference (Eso - Marc. %) |
Relative difference (Marconi as reference %) |
|
350 |
79 |
63.8 |
15.2 |
23.8 |
|
400 |
89.9 |
84 |
5.9 |
7 |
|
500 |
84.2 |
82 |
2.2 |
2.7 |
|
650 |
74.8 |
75.2 |
-0.4 |
-0.5 |
|
900 |
27.5 |
28 |
-0.5 |
-1.8 |
Table 2: Difference and relative difference between ESO measurement and Marconi.
Figure 4: Graphic representation of the difference and the relative difference.
For the flat field we use three wavelengths, 350nm, 600nm and 900nm. For each wavelength we make two images, high level (45000 ADU) and low level (1000 ADU).
350nm (UV), bandwidth 5nm |
600nm, bandwidth 5nm |
900nm, bandwidth 5nm |
|||
High level |
Low level |
High level |
Low level |
High level |
Low level |
Table 3: Flat field for three wavelengths.
The time exposure, for the long dark exposure, is 3600 seconds.
Table 4: Bias and dark.
Left readout port
Conversion Factor=   0.56163e-/ADU ±0.001813     for 25474.7ADU
RMS noise        =   2.4803e-      ±0.11

Right readout port
Clock mode: 50kpx/4p/HG/512
Conversion Factor=   0.53092e-/ADU ±0.001675     for 26770.6ADU
RMS noise        =   2.6915e-      ±0.1277


Right readout port
Clock mode: EEV 1p/225k/HG 512
Conversion Factor=   0.51234e-/ADU ±0.001195     for 27664.7ADU
RMS noise        =   6.6897e-      ±0.3355
Clock mode: 50kpx/4p/HG/512
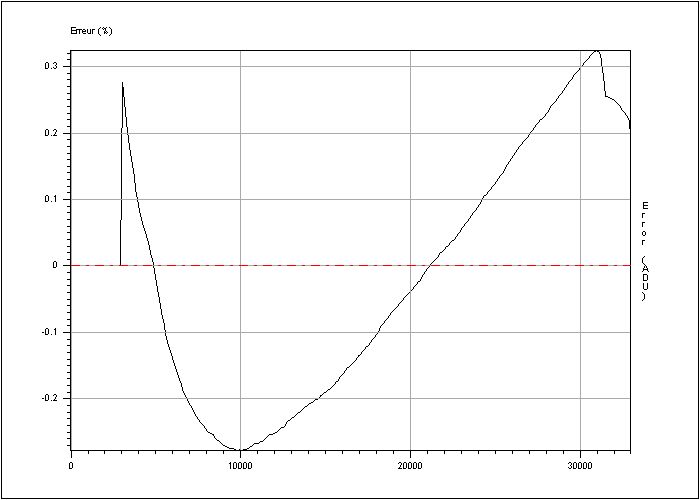
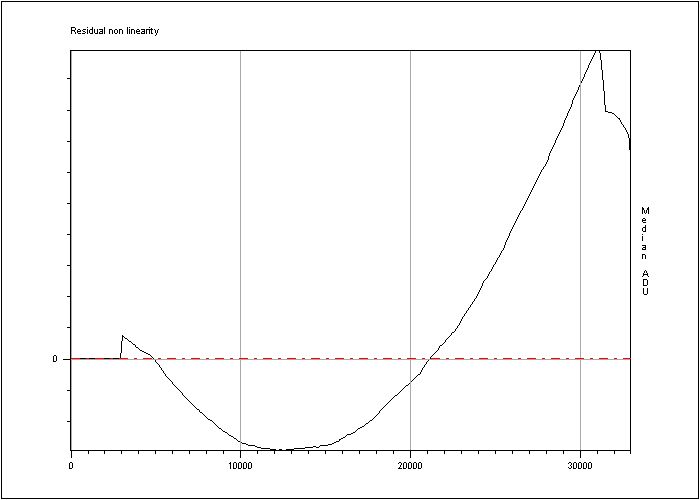
RMS non linearity (%)         =    0.193412
Peak to peak non linearity (%)=    0.601847

Figure 5: Error of linearity

Figure 6: Residual non linearity.
Exposure time (s) = 3600
Dark current : 0.16 ± 0.01 e-/hour/pixel
Horizontal CTE = 0.999996
Vertical CTE = 0.9999994
In this section we expose the hot pixel, the dark pixel, the trap and the very large trap we found and how.
A hot pixel provides a signal of > 60 e- / pixel / hour.
Result: Eighteen hot points.
On our images these points are to the coordinates:
|
Position |
Image |
Histogram around the hot pixel |
X= 1418; Y= 0106 |
|
|
X= 1416; Y= 0174 |
|
|
X= 0570; Y= 0205 X= 0571; Y= 0205 X= 0572; Y= 0205 X= 0573; Y= 0205 X= 0574; Y= 0205 X= 0575; Y= 0205 X= 0576; Y= 0205 X= 0578; Y= 0205 X= 0579; Y= 0205 X= 0581; Y= 0205 X= 0580; Y= 0205 X= 0582; Y= 0205 X= 0584; Y= 0205 |
|
|
X= 0074; Y= 0370 |
|
|
X= 2040; Y= 0530 X= 2041; Y= 0530 |
|
|
Table 5: Position
and images of the hot pixels. The values in the table are in ADU and
the
conversion factor is 1.1 e-/ADU. All the point above 54 ADU
are hot points.
A dark pixel is one with 50% or less than the average output for uniform intensity light level, measured with a flat field level around 500 photo-electrons.
Result: Two dark pixels detected.
|
Position |
Image |
Histogram around the hot pixel |
|---|---|---|
X= 1945; Y= 2489 |
|
|
X= 0209; Y= 3167 |
|
|
Table 6: Position and images of the dark pixels. All the point under 747 ADU are dark points.
A trap is defined as a pixel that captures more than 10 electrons, measured with a flat field level around 500 photo-electrons.
Result: Not available
A very large trap is defined as a pixel that captures more than 10 000 electrons, measured with a flat field level around 90% of full well capability.
Result: See the section bad column. We have three very large trap.
A bad column is 10 or more contiguous hot or dark pixels in a single column or a very bright pixel or a very large trap.
Result: Three bad columns:
|
Position |
Image |
Histogram around the very large trap |
|---|---|---|
X= 1118; Y= 2678 |
|
|
X= 1091; Y= 3928 X= 1092; Y= 3927 |
|
|
Table7: Position and images of the bad column.
Here is a summary of cosmetic defects:
|
|
Hot pixel |
Dark pixel |
Trap |
Very large trap |
Bad column |
|---|---|---|---|---|---|
|
ESO |
18 |
2 |
/ |
3 |
3 |
|
Marconi |
58 |
5 |
1 |
3 |
|
Table 8: Summary of cosmetic defects.
Back to the overview page ESO Test Reports for the OmegaCAM CCDs