![[ ESO ]](http://www.eso.org/images/eso-logo.gif)
3.6 / EFOSC II / CCD Loral/Lesser #40
| HOME | INDEX | SEARCH | HELP | NEWS |
![[ ESO ]](http://www.eso.org/images/eso-logo.gif) |
||||||
|---|---|---|---|---|---|---|
3.6 / EFOSC II / CCD Loral/Lesser #40
|
||||||
|
||||||
| TYPE | Loral/Lesser | ||
| Thinned, AR coated,UV flooded, MPP | |||
| IMAGE SIZE [pixels] | 2048 x 2048 (0 prescan pixels in horizontal direction) | ||
| PIXEL SIZE [microns] | 15 x 15 | ||
| DARK CURRENT [e- / pixel / hr] | <1 at 140 K | ||
| FULL WELL CAPACITY [e- / pixel] | 104k | ||
| CONTROLLER | ESO FIERA | ||
| Mode | normal [27 kpixel / sec] | fast [60 kpixel / sec] | very fast [97 kpixel / sec] |
| R.O.N. [e- rms] | 7.5 | 8.5 | 13 |
| CONVERSION FACTOR [e- / ADU] | 1.3 | 1.4 | 1.4 |
| Full Frame READOUT TIME [sec] | 160 | 70.5 | 44 |
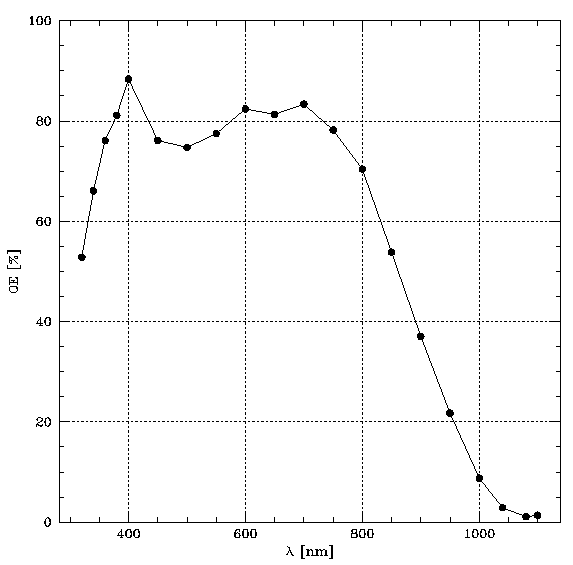
Quantum efficiency

The CCD system (CCD + FIERA controller) shows a linearity better than ± 0.4 % over the full range of the 16 bit analog to digital converter (ADC). The system linearity has been explored in a range of 2000e up to 83000e.
The electronics have been tuned so that the ADC will saturate before non-linearity is reached.
| (in electrons) |
Normal
|
Fast
|
Very fast
|
| CF |
1.35
|
1.35
|
1.38
|
| ADU RON |
7.8
|
8.2
|
12.7
|
Serial CTE = 0.999998 and Parallel CTE = 0.99998
The cosmic ray event rate is 1.9 [events / min / cm ²]
The Remanence test was made after 10 hours in the dark and periodical wiping at at temperature of 158 K. After a high level flat field with white light which give over-saturation on the CCD, several ten minutes dark exposures have been taken. The mean level in the centre of these dark exposures was compared with the mean level of a ten minute dark before these saturations and the remanence in e-/px has been calculated The results can be seen in the table above
The homogeneity was measured using a standard method of sampling the whole sensitive area and using the RMS value of it. Values of deviations from homogeneity are given in the table below
| Flat-field exposure at wavelength in [nm] |
Maximal RMS Deviation from mean value [%] |
| 320 | 5.36 |
| 340 | 4.45 |
| 360 | 4.23 |
| 380 | 4.36 |
| 400 | 4.54 |
| 450 | 4.16 |
| 500 | 4.04 |
| 550 | 3.82 |
| 600 | 3.98 |
| 650 | 4.10 |
| 700 | 3.71 |
| 750 | 3.81 |
| 800 | 3.90 |
| 850 | 3.69 |
| 900 | 3.73 |
| 950 | 3.94 |
| 1000 | 4.13 |
| 1040 | 5.21 |
| 1080 | 5.32 |
| 1100 | 4.37 |
Amplifier 1
All measurements done with weak light images (300 e-/px)
No hot spots, cluster and columns noticed.
52 dark pixels, 295 dark cluster, 66 dark columns and 262 traps
Amplifier 2
All measurements done with weak light images (300 e-/px)
No hot spots, cluster and columns noticed.
37 dark pixels, 311 dark cluster, 65 dark columns and 307 traps

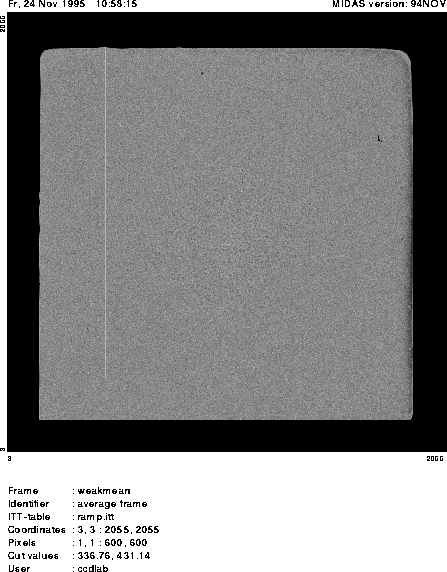
Weak Flat Field at 700 nm with Amplifier 2.
In August 1998 EFOSC 2 was upgraded to use a FIERA controller.
It was transferred to the 3.6m telescope in December 1997 and it is thus not available anymore at the 2.2 m telescope.
Date of last set of tests at the 2.2 m telescope: May 4, 1997
Date of delivery at the 2.2 m telescope: August 1996
| Previous test: May 4, 1997 | ||
|---|---|---|
| DARK CURRENT [e- / pixel / hr] | 5.46 at 140 K | |
| Mode | slow [17 kpixel / sec] | fast [38 kpixel / sec] |
| R.O.N. [e- rms] | 6.3 | 7.8 |
| CONVERSION FACTOR [e- / ADU] | 1.6 | 1.3 |
| Previous test: August 31, 1996 | ||
| DARK CURRENT [e- / pixel / hr] | 5.46 at 140 K | |
| Mode | slow [17 kpixel / sec] | fast [38 kpixel / sec] |
| R.O.N. [e- rms] | 6.21 | 7.8 |
| CONVERSION FACTOR [e- / ADU] | 1.6 | 1.34 |
|
|
|||
|
|
|||