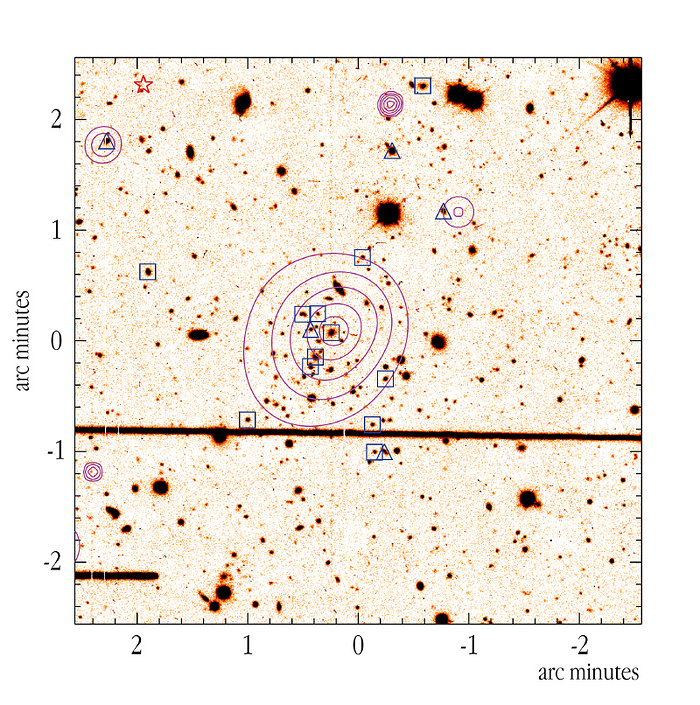
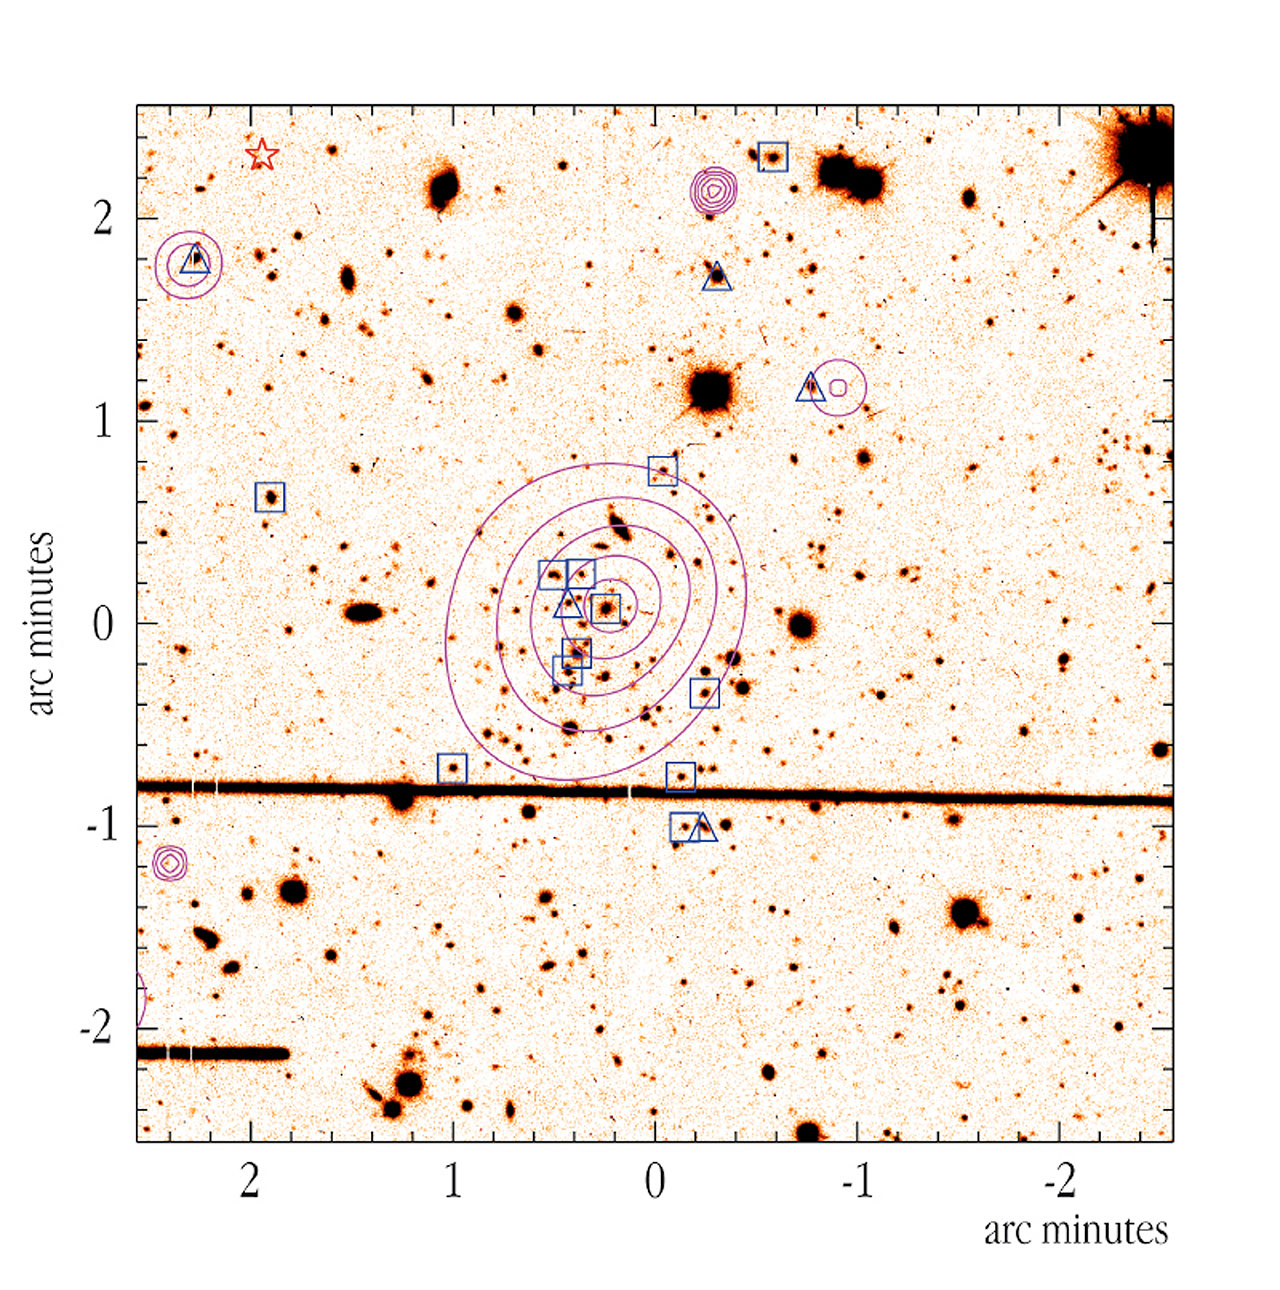
XMM-Newton contour map overlaid on a CFHT I-band image
XMM-Newton X-ray contour map of the probable extent of a cluster of galaxies superimposed upon the CFHT I-band image. A concentration of distant galaxies is conspicuous, thus confirming the X-ray detection. The symbols indicate the galaxies which have been subject to a subsequent spectroscopic measurement and found to be cluster members (triangles flag emission line galaxies). Following the X-ray discovery and the optical cluster identification, galaxies in the cluster field have been spectroscopically observed at the ESO VLT using the FORS2 instrument in order to determine the cluster redshift. Using two masks, each of them observed during one hour, allowing to take the spectra of 16 emission-line galaxies at a time, the cluster was found to have a redshift of 0.84, corresponding to a distance of 8,000 million light-years, and a velocity dispersion of 750 km/s.
Crediti:ESO
Riguardo l'immagine
| Identificazione: | eso0320c |
| Tipo: | Mappa |
| Data di rilascio: | 14 Luglio 2003 |
| Notizie relative: | eso0320 |
| Grandezza: | 1789 x 1771 px |
Riguardo all'oggetto
| Nome: | FORS2, Galaxy cluster |
| Tipo: | Early Universe : Galaxy : Grouping : Cluster |
| Distanza: | z=0.84 (spostamento del rosso) |
| Categoria: | Galaxy Clusters |
Formati delle immagini
Colori e filtri
| Banda | Telescopio |
|---|---|
| Infrarosso I | Other |
Note: The contours were added based on X-ray data collected by the XMM-Newton.