Echelle spectrum of SN1987A
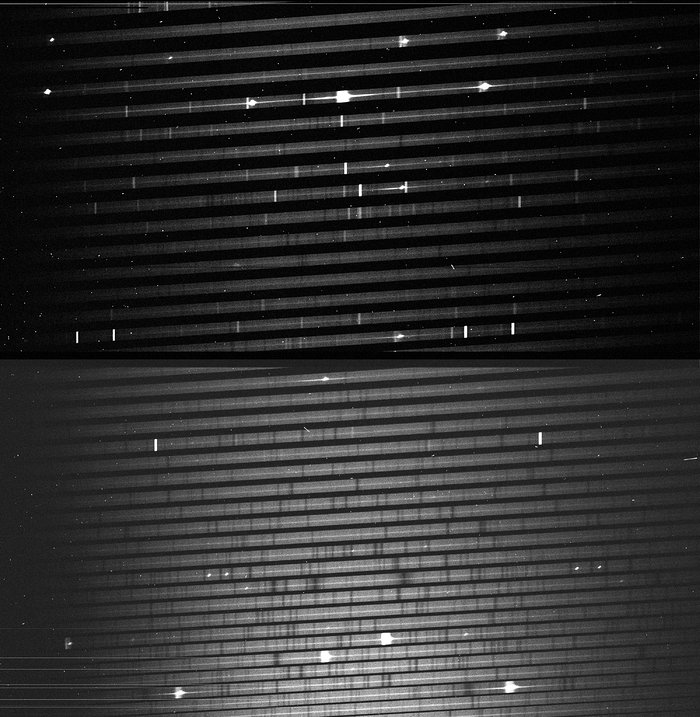
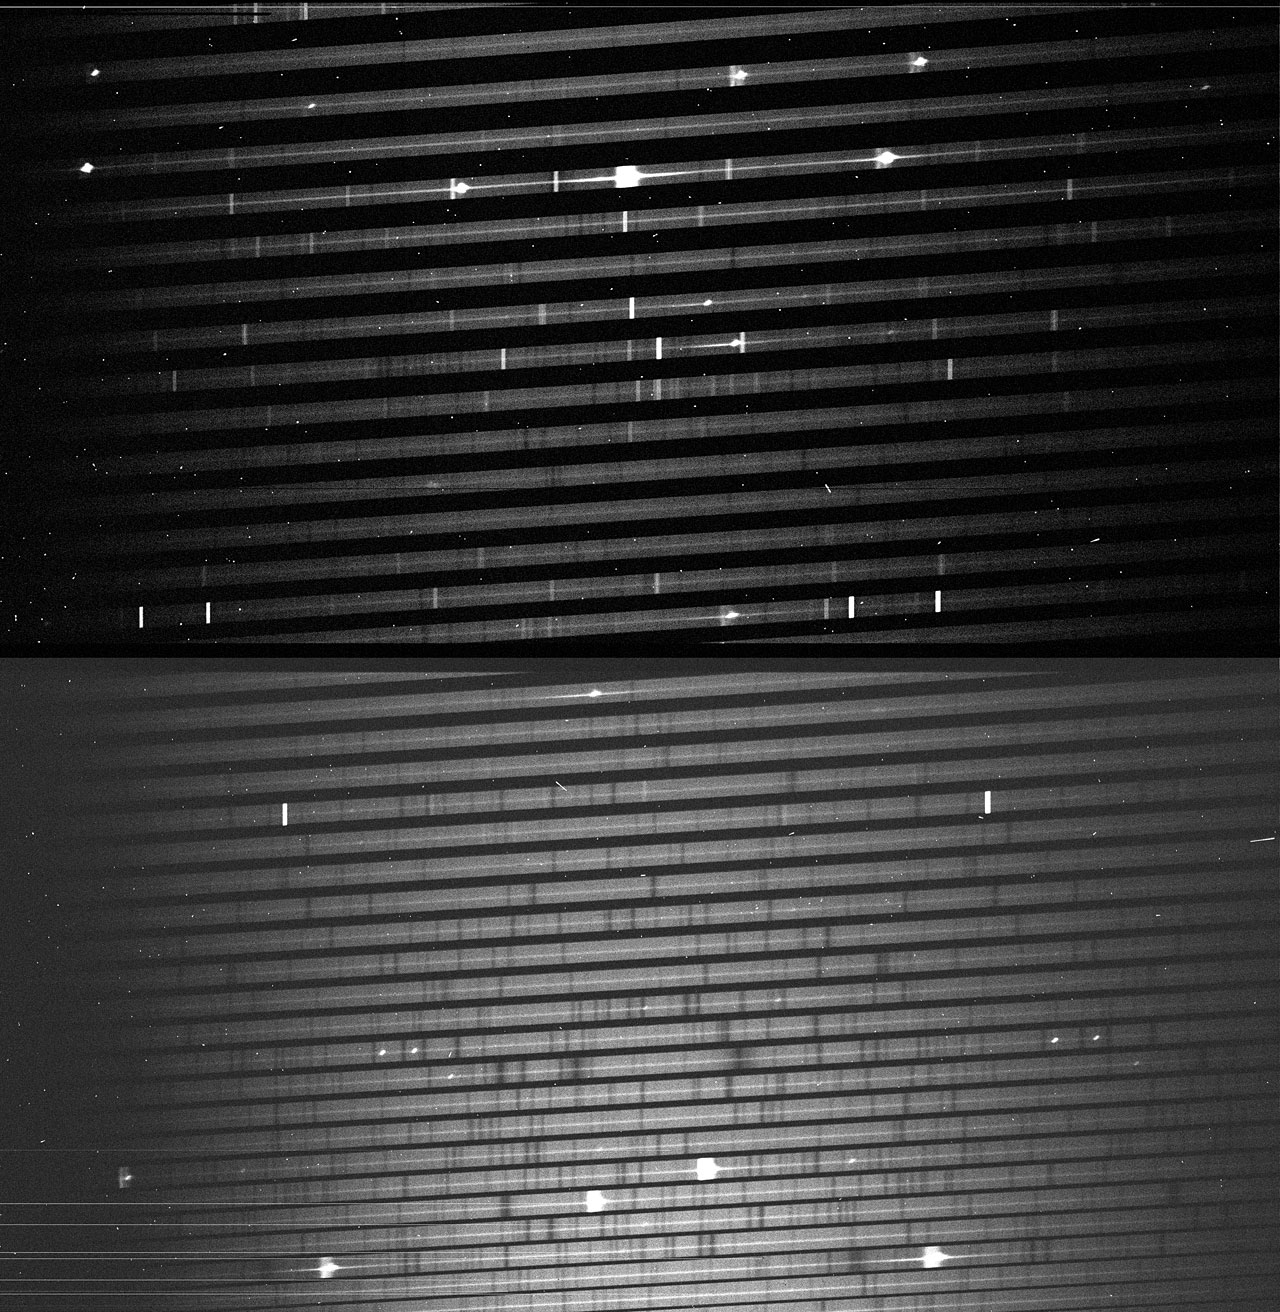
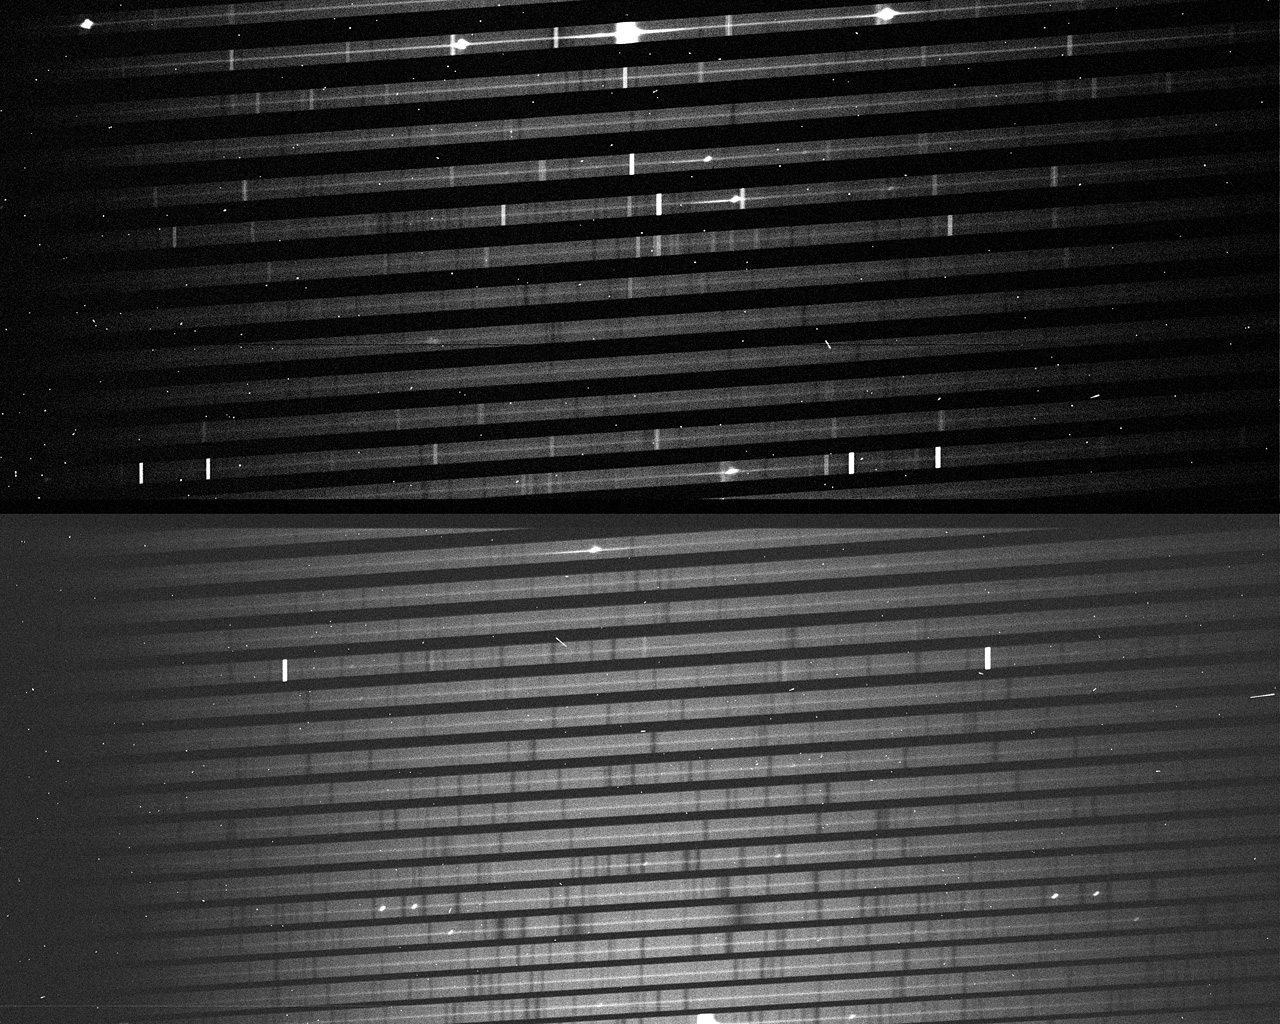
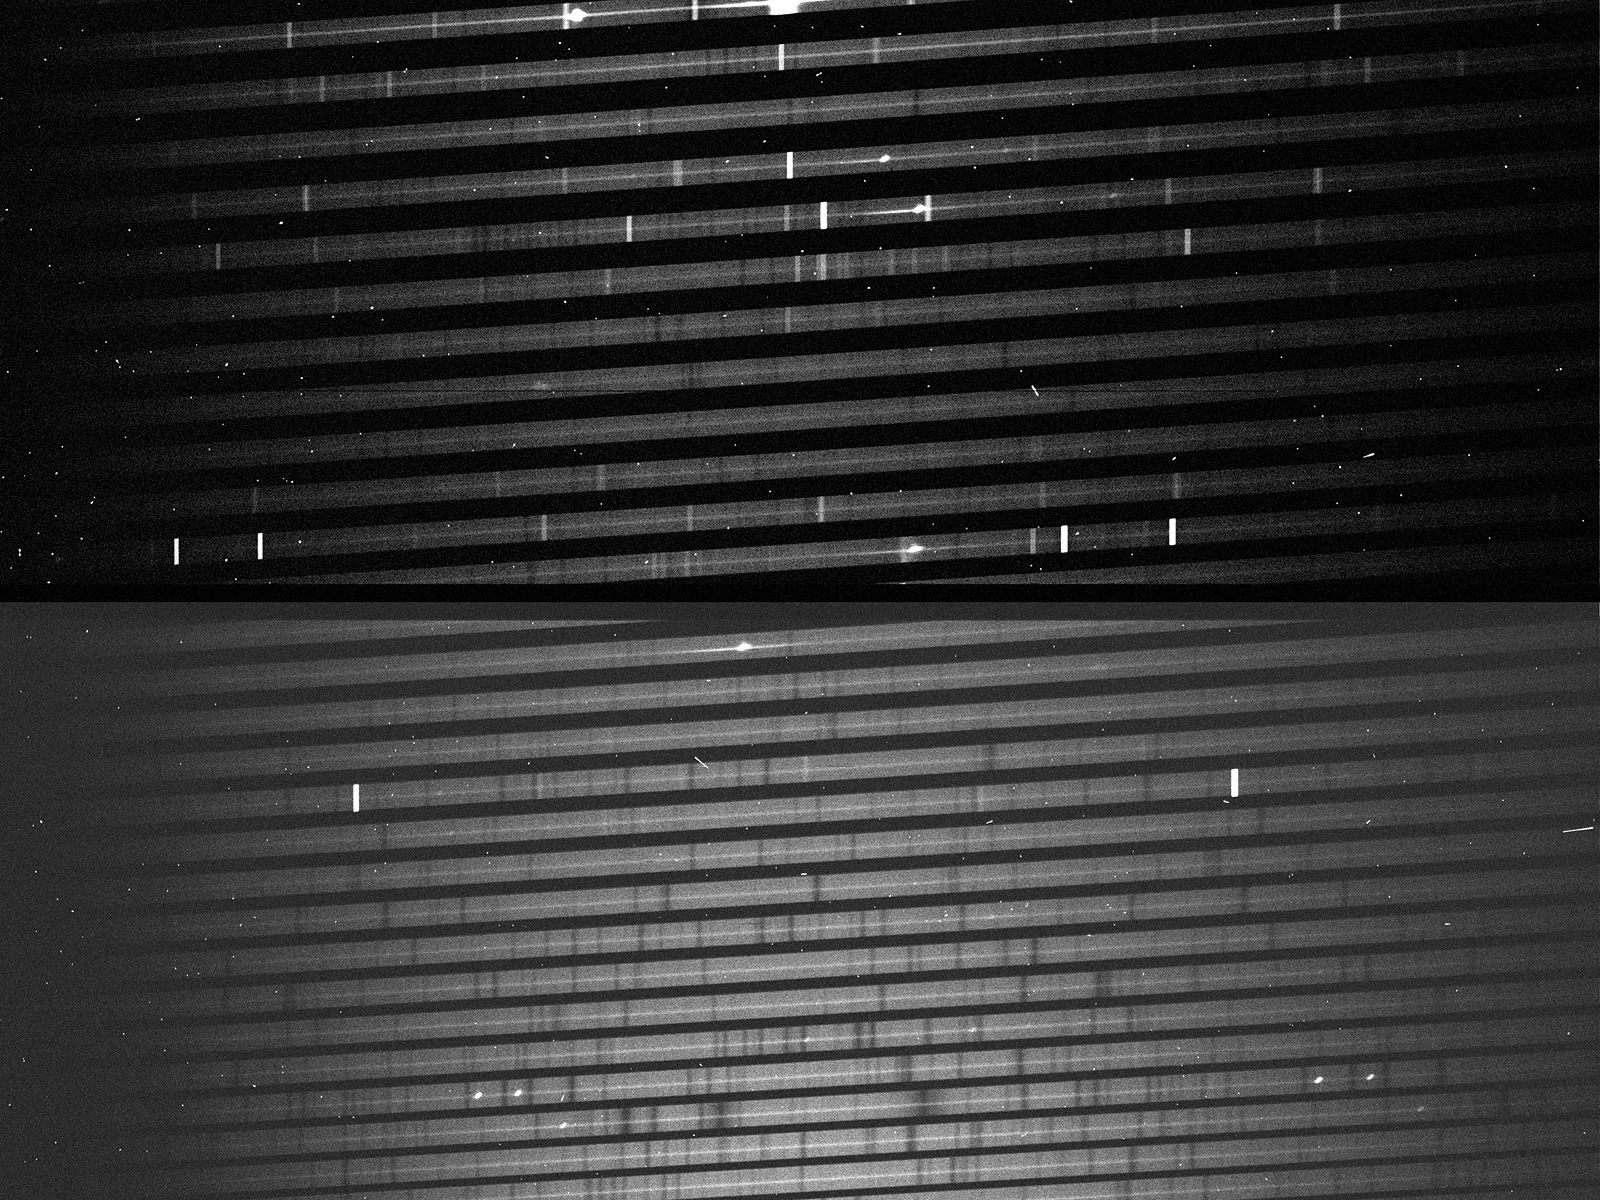
This shows the raw image, as read from the CCD, with the recorded echelle spectrum of SN1987A. With this technique, the supernova spectrum is divided into many individual parts (spectral orders, each of which appears as a narrow horizontal line) that together cover the wavelength interval from 479 to 682 nm (from the bottom to the top), i.e. from blue to red light. Many bright emission lines from different elements are visible, e.g. the strong H-alpha line from hydrogen near the centre of the fourth order from the top. Emission lines from the terrestrial atmosphere are seen as vertical bright lines that cover the full width of the individual horizontal bands. Since this exposure was done with the nearly Full Moon above the horizon, an underlying, faint absorption-line spectrum of reflected sunlight is also visible. The exposure time was 30 min and the seeing conditions were excellent (0.5 arcsec).
Bildnachweis:ESO
Über das Bild
| ID: | eso9944b |
| Typ: | Beobachtung |
| Veröffentlichungsdatum: | 5. Oktober 1999 |
| Dazugehörige Veröffentlichungen: | eso9944 |
| Größe: | 4096 x 4208 px |
Über das Objekt
| Name: | SN 1987A, Spectrum |
| Typ: | Local Universe : Star : Evolutionary Stage : Supernova |
| Entfernung: | 170000 Lichtjahre |
| Kategorie: | Stars |
Bildformate
Bildschirm-Hintergrundbilder
Farben & Filter
| Spektralbereich | Teleskop |
|---|---|
| Optisch | Very Large Telescope UVES |