|
|
| VISIR trending system: HISTORY report |
|
|
|
Last update: 2021-01-15T02:00:17 (UT)
|
|
|
|
|
*Date on this monitor changes at 21:00 UT |
|

|
|
|
Plot
? |
Symb
? |
Source
* |
Average ? |
Thresholds ? |
N_
data |
QC1
parameter |
Data
downloads |
Remarks |
| method |
value |
unit |
method |
value |
| 1 |
• | QC1DB |
MEDIAN |
|
ADU |
none | |
0 |
ins_sens30_val |
this |
last_yr |
all
|
temperature of the imaging detector |
| 2 |
• | QC1DB |
MEDIAN |
|
ADU |
none | |
0 |
ins_sens31_val |
this |
last_yr |
all
|
temperature of the spectroscopic detector |
| |
|
*Data sources: QC1DB: QC1 database; LOCAL: local data source
|
| Plot 1 | | data source: | visir_dark_img
(QC1 database) |
| dataset: | ins_sens30_val | • |
| median: | no data | ADU |
| thresholds: | none | |
| N_data plotted: | 0 |
| [click plot for closeup] |
| Plot 2 | | data source: | visir_dark_spc
(QC1 database) |
| dataset: | ins_sens31_val | • |
| median: | no data | ADU |
| thresholds: | none | |
| N_data plotted: | 0 |
| [click plot for closeup] |
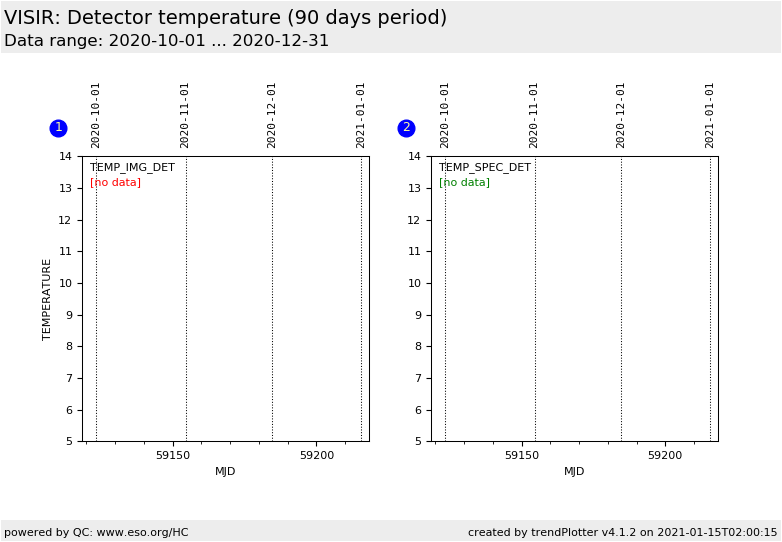
This is a trending plot monitoring temperatures of the VISIR imaging
and spectroscopic detectors. As of May 12, 2010 the temperature of the
imaging detector is read from keyword INS_TEMP30_VAL and of the
spectroscopic detector from keyword INS_TEMP31_VAL. Before that date
different keywords were used - INS_SENS30_VAL and INS_SENS31_VAL
respectively.
General information
Click on any of the plots to see a close-up version.
The latest date is indicated on top of the plot.
If configured,
- data points belonging to the latest date are specially marked
- statistical averages are indicated by a solid line, and thresholds by broken lines
- outliers are marked by a red asterisk. They are defined as data points outside the
threshold lines
- "aliens" (= data points outside the plot Y limits) are marked by a red arrow (↑ or ↓)
- you can download the data for each parameter set if the 'Data downloads' link shows up
|