[page auto-refreshes after 60 sec]
[press Ctrl+R to enforce refresh of scores and dates]
| VISIR trending system: HISTORY plot | |||||||||||||||||||||||||||||||||||||||||||||||||||||||||||||||||||
| Last update: 2009-01-29T09:14:19 (UT) | |||||||||||||||||||||||||||||||||||||||||||||||||||||||||||||||||||
|
|||||||||||||||||||||||||||||||||||||||||||||||||||||||||||||||||||

|
|||||||||||||||||||||||||||||||||||||||||||||||||||||||||||||||||||
|
|||||||||||||||||||||||||||||||||||||||||||||||||||||||||||||||||||
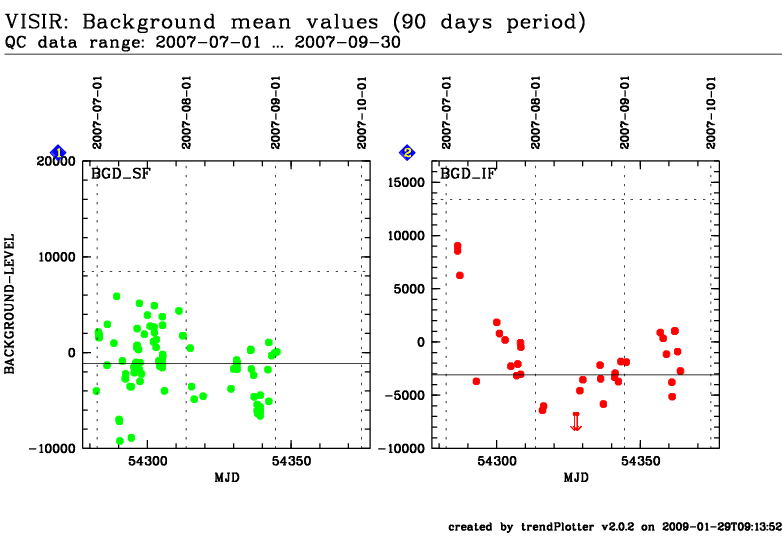
Historical mean background values from imaging standard star observations using the pre-upgrade detector. Only data taken with the PAH1 filter are selected. The plot is separated into small-field (SF) pixel field of view (0.075 arcsec/pixel) and intermediate-field (IF) pixel field of view (0.127 arcsec/pixel). The background level is determined from the half-cycle frames where no offset correction (32768 value added for each pixel) was applied. General information Click on any of the plots to see a close-up version. The latest date is indicated on top of the plot, data points belonging to that date are specially marked. If configured,
|
|||||||||||||||||||||||||||||||||||||||||||||||||||||||||||||||||||