|
|
| VIRCAM trending system: HISTORY report |
|
|
|
Last update: 2023-03-05T04:44:19 (UT)
|
|
|
|
|
*Date on this monitor changes at 21:00 UT |
|

|
|
|
Plot
? |
Symb
? |
Source
* |
Average ? |
Thresholds ? |
N_
data |
QC1
parameter |
Data
downloads |
Remarks |
| method |
value |
unit |
method |
value |
| 1 |
• | QC1DB |
none |
|
K |
none | |
382 |
qc_temp_1AB |
this |
last_yr |
all
|
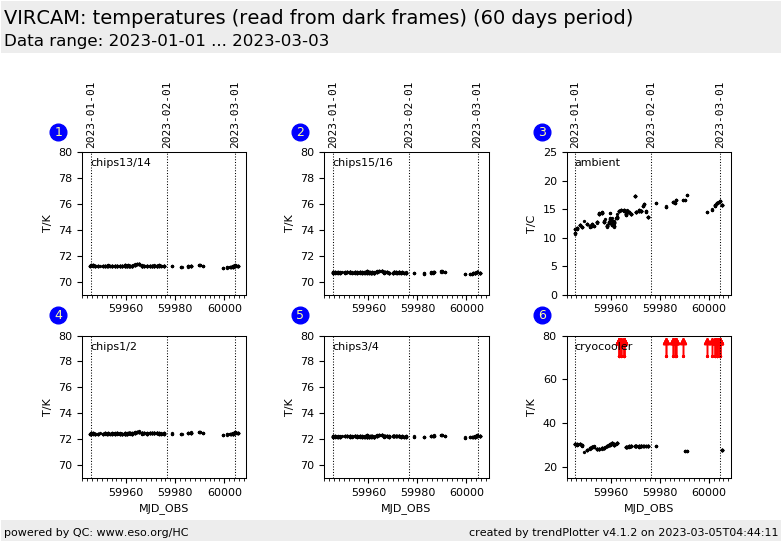
sensor for science detectors chips \#13 and \#14 |
| 2 |
• | QC1DB |
none |
|
K |
none | |
382 |
qc_temp_1CD |
this |
last_yr |
all
|
sensor for science detectors chips \#15 and \#16 |
| 3 |
• | QC1DB |
none |
|
K |
none | |
382 |
qc_temp_amb |
this |
last_yr |
all
|
ambient temperature |
| 4 |
• | QC1DB |
none |
|
K |
none | |
382 |
qc_temp_4BA |
this |
last_yr |
all
|
sensor for science detectors chips \#1 and \#2 |
| 5 |
• | QC1DB |
none |
|
K |
none | |
382 |
qc_temp_4DC |
this |
last_yr |
all
|
sensor for science detectors chips \#3 and \#4 |
| 6 |
• | QC1DB |
none |
|
K |
none | |
382 |
qc_temp_cryo1 |
this |
last_yr |
all
|
sensor at cryo cooler 1 2nd |
| |
|
*Data sources: QC1DB: QC1 database; LOCAL: local data source
|
| Plot 1 | | data source: | vircam_dark
(QC1 database) |
| dataset: | qc_temp_1AB | • |
| average: | none |
| thresholds: | none |
| N_data plotted: | 382 |
| [click plot for closeup] |
| Plot 2 | | data source: | vircam_dark
(QC1 database) |
| dataset: | qc_temp_1CD | • |
| average: | none |
| thresholds: | none |
| N_data plotted: | 382 |
| [click plot for closeup] |
| Plot 3 | | data source: | vircam_dark
(QC1 database) |
| dataset: | qc_temp_amb | • |
| average: | none |
| thresholds: | none |
| N_data plotted: | 382 |
| [click plot for closeup] |
| Plot 4 | | data source: | vircam_dark
(QC1 database) |
| dataset: | qc_temp_4BA | • |
| average: | none |
| thresholds: | none |
| N_data plotted: | 382 |
| [click plot for closeup] |
| Plot 5 | | data source: | vircam_dark
(QC1 database) |
| dataset: | qc_temp_4DC | • |
| average: | none |
| thresholds: | none |
| N_data plotted: | 382 |
| [click plot for closeup] |
| Plot 6 | | data source: | vircam_dark
(QC1 database) |
| dataset: | qc_temp_cryo1 | • |
| average: | none |
| thresholds: | none |
| N_data plotted: | 382 |
| [click plot for closeup] |
This plot shows the temperature of the four science detector sensors,
as read from the master dark product frames.
General information
Click on any of the plots to see a close-up version.
The latest date is indicated on top of the plot.
If configured,
- data points belonging to the latest date are specially marked
- statistical averages are indicated by a solid line, and thresholds by broken lines
- outliers are marked by a red asterisk. They are defined as data points outside the
threshold lines
- "aliens" (= data points outside the plot Y limits) are marked by a red arrow (↑ or ↓)
- you can download the data for each parameter set if the 'Data downloads' link shows up
|