Plot
? |
Symb
? |
Source
* |
Average ? |
Thresholds ? |
N_
data |
QC1
parameter |
Data
downloads |
Remarks |
| method |
value |
unit |
method |
value |
| 1 |
• | QC1DB |
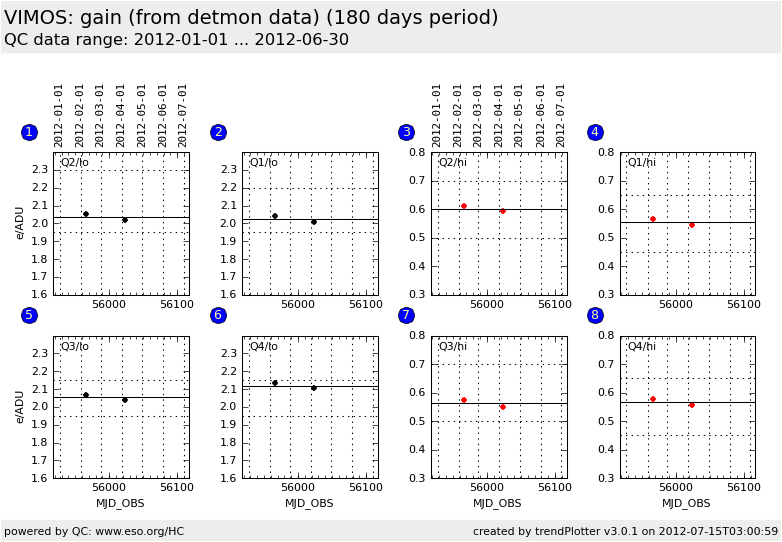
MEDIAN |
2.0355 |
NONE |
VAL | 1.95,2.3 |
2 |
gain |
this |
last_yr |
all
|
gain (e-/ADU), Q2, low gain |
| 2 |
• | QC1DB |
MEDIAN |
2.027 |
NONE |
VAL | 1.95,2.2 |
2 |
gain |
this |
last_yr |
all
|
gain (e-/ADU), Q1, low gain |
| 3 |
• | QC1DB |
MEDIAN |
0.602 |
NONE |
VAL | 0.5,0.7 |
2 |
gain |
this |
last_yr |
all
|
gain (e-/ADU), Q2, high gain |
| 4 |
• | QC1DB |
MEDIAN |
0.555 |
NONE |
VAL | 0.45,0.65 |
2 |
gain |
this |
last_yr |
all
|
gain (e-/ADU), Q1, high gain |
| 5 |
• | QC1DB |
MEDIAN |
2.053 |
NONE |
VAL | 1.95,2.15 |
2 |
gain |
this |
last_yr |
all
|
gain (e-/ADU), Q3, low gain |
| 6 |
• | QC1DB |
MEDIAN |
2.1175 |
NONE |
VAL | 1.95,2.15 |
2 |
gain |
this |
last_yr |
all
|
gain (e-/ADU), Q4, low gain |
| 7 |
• | QC1DB |
MEDIAN |
0.562 |
NONE |
VAL | 0.5,0.7 |
2 |
gain |
this |
last_yr |
all
|
gain (e-/ADU), Q3, high gain |
| 8 |
• | QC1DB |
MEDIAN |
0.567 |
NONE |
VAL | 0.45,0.65 |
2 |
gain |
this |
last_yr |
all
|
gain (e-/ADU), Q4, high gain |
| |
|
*Data sources: QC1DB: QC1 database; LOCAL: local text file
|
| Plot 1 | | data source: | vimos_detmon
(QC1 database) |
| dataset: | gain | • |
| median: | 2.0355 | NONE |
| fixed thresholds: | 1.95...2.3 | NONE |
| N_data plotted: | 2 |
| [click on plot for closeup] |
| Plot 2 | | data source: | vimos_detmon
(QC1 database) |
| dataset: | gain | • |
| median: | 2.027 | NONE |
| fixed thresholds: | 1.95...2.2 | NONE |
| N_data plotted: | 2 |
| [click on plot for closeup] |
| Plot 3 | | data source: | vimos_detmon
(QC1 database) |
| dataset: | gain | • |
| median: | 0.602 | NONE |
| fixed thresholds: | 0.5...0.7 | NONE |
| N_data plotted: | 2 |
| [click on plot for closeup] |
| Plot 4 | | data source: | vimos_detmon
(QC1 database) |
| dataset: | gain | • |
| median: | 0.555 | NONE |
| fixed thresholds: | 0.45...0.65 | NONE |
| N_data plotted: | 2 |
| [click on plot for closeup] |
| Plot 5 | | data source: | vimos_detmon
(QC1 database) |
| dataset: | gain | • |
| median: | 2.053 | NONE |
| fixed thresholds: | 1.95...2.15 | NONE |
| N_data plotted: | 2 |
| [click on plot for closeup] |
| Plot 6 | | data source: | vimos_detmon
(QC1 database) |
| dataset: | gain | • |
| median: | 2.1175 | NONE |
| fixed thresholds: | 1.95...2.15 | NONE |
| N_data plotted: | 2 |
| [click on plot for closeup] |
| Plot 7 | | data source: | vimos_detmon
(QC1 database) |
| dataset: | gain | • |
| median: | 0.562 | NONE |
| fixed thresholds: | 0.5...0.7 | NONE |
| N_data plotted: | 2 |
| [click on plot for closeup] |
| Plot 8 | | data source: | vimos_detmon
(QC1 database) |
| dataset: | gain | • |
| median: | 0.567 | NONE |
| fixed thresholds: | 0.45...0.65 | NONE |
| N_data plotted: | 2 |
| [click on plot for closeup] |
Trending plot for gain (e-/ADU) measurements from detector monitoring data.
Data are taken from detector monitoring calibrations which are series of flat
fields with increasing exposure time. The gain is calculated using the
Photon Transfer Curve (PTC) method or using the median of all measured gain
values (MED).
Only the central 1600 x 1800 pixles are used for calculation of detector
monitoring parameters (since 2009-10-09).
Since 2015-02-02, only flats with less than 5000 ADU are used for gain computation.
Also, the method has been switched from PTC to MED.
Template ID: tec_DetLin. Pipeline recipe: detmon_opt_lg.
General information
Click on any of the plots to see a close-up version.
The latest date is indicated on top of the plot, data points belonging to that date are specially marked.
If configured,
- statistical averages are indicated by a solid line, and thresholds by broken lines
- outliers are marked by a red asterisk. They are defined as data points outside the
threshold lines
- "aliens" (= data points outside the plot Y limits) are marked by a red arrow (↑ or ↓)
- you can download the data for each parameter set if the 'Data downloads' link shows up
|
