Plot
? |
Symb
? |
Source
* |
Average ? |
Thresholds ? |
N_
data |
QC1
parameter |
Data
downloads |
Remarks |
| method |
value |
unit |
method |
value |
| 1 |
• | QC1DB |
MEDIAN |
916.43628 |
pix |
VAL | 915,919 |
80 |
x0 |
this |
last_yr |
all
|
coefficient x0, Q2 |
| 2 |
• | QC1DB |
MEDIAN |
1114.40405 |
pix |
VAL | 1112,1116 |
78 |
x0 |
this |
last_yr |
all
|
coefficient x0, Q1 |
| 5 |
• | QC1DB |
MEDIAN |
1033.11304 |
pix |
VAL | 1030.5,1034.5 |
79 |
x0 |
this |
last_yr |
all
|
coefficient x0, Q3 |
| 6 |
• | QC1DB |
MEDIAN |
1085.79749 |
pix |
VAL | 1086.5,1090.5 |
79 |
x0 |
this |
last_yr |
all
|
coefficient x0, Q4 |
| 3 |
• | QC1DB |
MEDIAN |
1063.07373 |
pix |
VAL | 1061.0,1063.0 |
80 |
y0 |
this |
last_yr |
all
|
coefficient y0, Q2 |
| 4 |
• | QC1DB |
MEDIAN |
1072.22144 |
pix |
VAL | 1070.5,1072.5 |
78 |
y0 |
this |
last_yr |
all
|
coefficient y0, Q1 |
| 7 |
• | QC1DB |
MEDIAN |
1389.14856 |
pix |
VAL | 1388.5,1390.5 |
79 |
y0 |
this |
last_yr |
all
|
coefficient y0, Q3 |
| 8 |
• | QC1DB |
MEDIAN |
1377.40332 |
pix |
VAL | 1376.0,1378.0 |
79 |
y0 |
this |
last_yr |
all
|
coefficient y0, Q4 |
| |
|
*Data sources: QC1DB: QC1 database; LOCAL: local text file
|
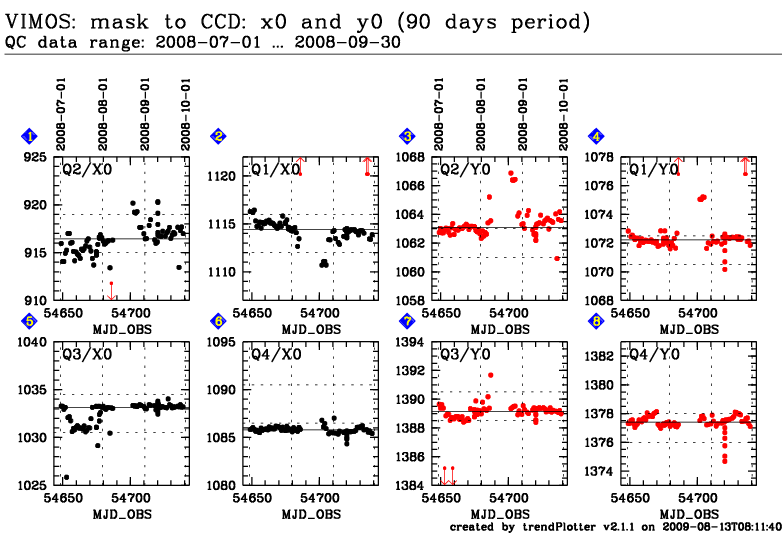
This plot
Trending plots for monitoring the coefficients of the mask to CCD transformation.
The transformation is as follows:
X = a(xx)*x + a(xy)*y + x(0)
Y = a(yx)*x + a(yy)*y + y(0)
with (x,y) being mask coordinates in mm and (X,Y) CCD coordinates in pixel.
X direction is along the slit orientation, y direction is perpendicular to
the slits (i.e. in dispersion direction).
These trending plots show the time evolution of x(0) and y(0). x(0) should
be within +/- 2 pixels around the average, y(0) within +/- 1 pixel.
These thresholds are indicated in the plots. The procedure in case of
violation of the thresholds is described on the
SciOps Wiki pages.
Template ID: img_tec_MaskToCcd. Pipeline recipe: vmmasktoccd.
General information
Click on any of the plots to see a close-up version.
The latest date is indicated on top of the plot, data points belonging to that date are specially marked.
If configured,
- statistical averages are indicated by a solid line, and thresholds by broken lines
- outliers are marked by a red asterisk. They are defined as data points outside the
threshold lines
- "aliens" (= data points outside the plot Y limits) are marked by a red arrow (↑ or ↓)
- you can download the data for each parameter set if the 'Data downloads' link shows up
|
