Plot
? |
Symb
? |
Source
* |
Average ? |
Thresholds ? |
N_
data |
QC1
parameter |
Data
downloads |
Remarks |
| method |
value |
unit |
method |
value |
| 1 |
• | QC1DB |
MEDIAN |
2.06 |
pixels |
VAL | -2.5,4 |
33 |
mean_dx |
this |
last_yr |
all
|
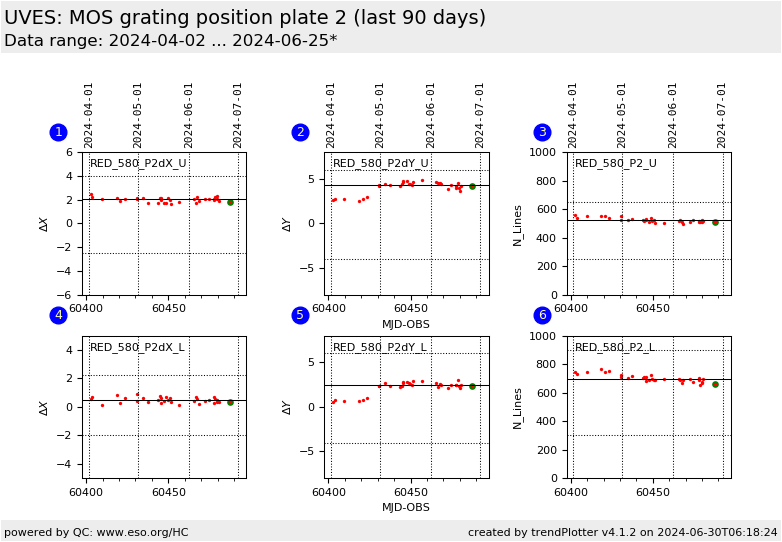
DeltaX between solution and Physical Model, from MOS FMTCHK data, 580.0nm, 1x1, Plate 2, RED UPPER CCD |
| 2 |
• | QC1DB |
MEDIAN |
4.34 |
pixels |
VAL | -4,6 |
33 |
mean_dy |
this |
last_yr |
all
|
DeltaY, same data set |
| 3 |
• | QC1DB |
MEDIAN |
522 |
pixels |
VAL | 250,650 |
33 |
nlin_sel |
this |
last_yr |
all
|
Number of lines used in the solution, same data set |
|
| 4 |
• | QC1DB |
MEDIAN |
0.461 |
pixels |
VAL | -2,2.2 |
33 |
mean_dx |
this |
last_yr |
all
|
DeltaX between solution and physical model, 580.0nm, 1x1, Plate 2, RED LOWER CCD |
| 5 |
• | QC1DB |
MEDIAN |
2.42 |
pixels |
VAL | -4,6 |
33 |
mean_dy |
this |
last_yr |
all
|
DeltaY, same data set |
| 6 |
• | QC1DB |
MEDIAN |
697 |
pixels |
VAL | 300,900 |
33 |
nlin_sel |
this |
last_yr |
all
|
Number of lines used in the solution, same data set |
| |
|
*Data sources: QC1DB: QC1 database; LOCAL: local data source
|
Plot 1
scores: not implemented
| | data source: | uves_fib_fmtchk
(QC1 database) |
| dataset: | mean_dx | • |
| median: | 2.06 | pixels |
| fixed thresholds: | -2.5...4 | pixels |
| N_data plotted: | 33 |
| [click plot for closeup] |
Plot 2
scores: not implemented
| | data source: | uves_fib_fmtchk
(QC1 database) |
| dataset: | mean_dy | • |
| median: | 4.34 | pixels |
| fixed thresholds: | -4...6 | pixels |
| N_data plotted: | 33 |
| [click plot for closeup] |
Plot 3
scores: not implemented
| | data source: | uves_fib_fmtchk
(QC1 database) |
| dataset: | nlin_sel | • |
| median: | 522 | pixels |
| fixed thresholds: | 250...650 | pixels |
| N_data plotted: | 33 |
| [click plot for closeup] |
Plot 4
scores: not implemented
| | data source: | uves_fib_fmtchk
(QC1 database) |
| dataset: | mean_dx | • |
| median: | 0.461 | pixels |
| fixed thresholds: | -2...2.2 | pixels |
| N_data plotted: | 33 |
| [click plot for closeup] |
Plot 5
scores: not implemented
| | data source: | uves_fib_fmtchk
(QC1 database) |
| dataset: | mean_dy | • |
| median: | 2.42 | pixels |
| fixed thresholds: | -4...6 | pixels |
| N_data plotted: | 33 |
| [click plot for closeup] |
Plot 6
scores: not implemented
| | data source: | uves_fib_fmtchk
(QC1 database) |
| dataset: | nlin_sel | • |
| median: | 697 | pixels |
| fixed thresholds: | 300...900 | pixels |
| N_data plotted: | 33 |
| [click plot for closeup] |
This is the trending report for the grating stability in FLAMES/UVES, derived from
the MOS format check calibrations taken with
wavelength setting 580, 1x1 binning and Plate 2.
Since 2007, these data are taken as part of the daily Health Checks. They are
not scored to avoid redundancy with the plate 1
plot.
Find more information in the description of the corresponding plot for
plate 1.
Find more information about FLAMES/UVES Grating Position monitoring here.
General information
Click on any of the plots to see a close-up version.
The latest date is indicated on top of the plot.
If configured,
- data points belonging to the latest date are specially marked
- statistical averages are indicated by a solid line, and thresholds by broken lines
- outliers are marked by a red asterisk. They are defined as data points outside the
threshold lines
- "aliens" (= data points outside the plot Y limits) are marked by a red arrow (↑ or ↓)
- you can download the data for each parameter set if the 'Data downloads' link shows up
|
