[page auto-refreshes after 300 sec]   [stop | on]            [press Ctrl+Shift+R to enforce refresh of scores, dates and news]
UVES trending system: FULL report
HELP USERS-GUIDE MORE
Last update: 2024-06-26T06:10:52 (UT)
  | now: 2024-06-26T12:33:58 (UT) muc02 QC pipeline: uves-6.1.11 (installed 2023-06-22)
close window history: 2007 2008 2009 2010 2011 2012 2013 2014 2015 2016 2017 2018 2019 2020 2021 2022 2023   2024   HEALTH FULL
  ... ... ... ... ... ... ... ... ... ... ... ... ... ... ... ...
*Date on this monitor changes at 21:00 UT
png: Information and research:
- png file - advanced studies: QC1 browser | QC1 plotter
- for reprocessing data: QC1_browser | QC1_plotter
Plot
?
Symb
?
Source
*
Average ? Thresholds ? N_
data
QC1
parameter
Data
downloads
Remarks
method value unit method value
1 QC1DB none   NONE none  10910 resol_med all (full time range) Average resolving power, from ARCLAMP data BLUE 437.0, 1x1, 0.4arcs slit
1 QC1DB none   NONE none  904 resol_med all (full time range) same, from reprocessing 2015 with uves/5.5.3
2 QC1DB none   NONE none  10125 int_avg all (full time range) Average intensity of selected lines, same data
2 QC1DB none   NONE none  903 int_avg all (full time range) same, from reprocessing 2015 with uves/5.5.3
3 QC1DB none   NONE none  9574 nlin_tot all (full time range) Number of lines found, same data
3 QC1DB none   NONE none  903 nlin_tot all (full time range) same, from reprocessing 2015 with uves/5.5.3
4 QC1DB none   NONE none  10799 resol_rms all (full time range) RMS of resolving power, same data
4 QC1DB none   NONE none  904 resol_rms all (full time range) same, from reprocessing 2015 with uves/5.5.3
5 QC1DB none   NONE none  8905 nlin_int all (full time range) Number of lines used in Integrated Average Intensity, same data
5 QC1DB none   NONE none  895 nlin_int all (full time range) same, from reprocessing 2015 with uves/5.5.3
6 QC1DB none   NONE none  7850 nlin_sol all (full time range) Number of lines actually used in final solution, same data
6 QC1DB none   NONE none  901 nlin_sol all (full time range) same, from reprocessing 2015 with uves/5.5.3
*Data sources: QC1DB: QC1 database; LOCAL: local data source
Plot 1
scores: not implemented
data source:uves_wave
(QC1 database)
dataset:
(numbers below apply to this dataset)
resol_med
average:none
thresholds:none
N_data plotted:10910
[click plot for closeup]
Plot 2
scores: not implemented
data source:uves_wave
(QC1 database)
dataset:
(numbers below apply to this dataset)
int_avg
average:none
thresholds:none
N_data plotted:10125
[click plot for closeup]
Plot 3
scores: not implemented
data source:uves_wave
(QC1 database)
dataset:
(numbers below apply to this dataset)
nlin_tot
average:none
thresholds:none
N_data plotted:9574
[click plot for closeup]
Plot 4
scores: not implemented
data source:uves_wave
(QC1 database)
dataset:
(numbers below apply to this dataset)
resol_rms
average:none
thresholds:none
N_data plotted:10799
[click plot for closeup]
Plot 5
scores: not implemented
data source:uves_wave
(QC1 database)
dataset:
(numbers below apply to this dataset)
nlin_int
average:none
thresholds:none
N_data plotted:8905
[click plot for closeup]
Plot 6
scores: not implemented
data source:uves_wave
(QC1 database)
dataset:
(numbers below apply to this dataset)
nlin_sol
average:none
thresholds:none
N_data plotted:7850
[click plot for closeup]
This plot

This is the trending report for monitoring UVES Resolution based on QC parameters derived from Wavelength Calibration frames.
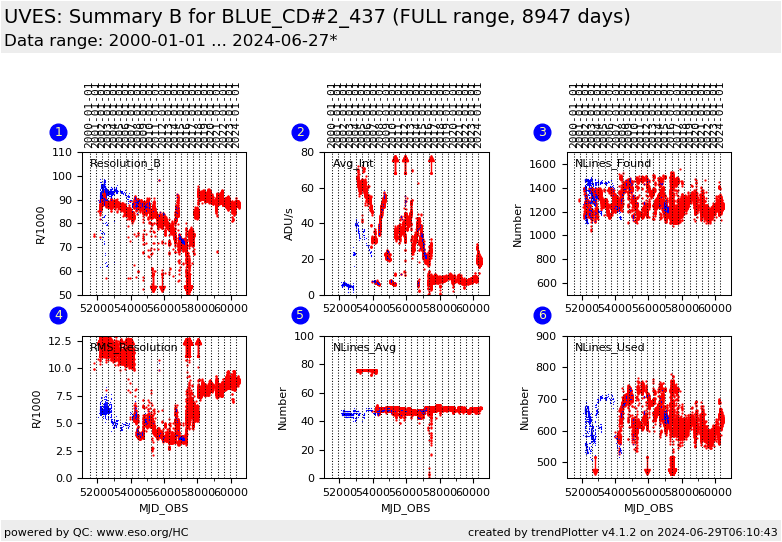
This report presents a second set of detailed parameters of the wavelength solution for BLUE 437, 1x1 binning data, 0.4 arcsec slit-width setup.
The individual plots describe:

  1. The average of the resolution values measured for each line included in the final selection, (this is a repeat of the data presented in the RESOLUTION overview report.
  2. The average intensity of the emission lines (to monitor the lamp performance).
  3. The total number of lines found in the frame. The pipeline automatically adjusts the detection threshold until the number of lines found falls within the --minlines and --maxlines parameters of the recipe, by default 1100 and 1600 for the BLUE chip.
  4. The RMS of the resolution values measured for each line included in the final selection
  5. The number of lines included in the calculation of the average of the intensity
  6. The number of lines included in the final wavelength calibration solution.
The blue dots refer to the master calibration reprocessing of the years 2000-2003 with the pipeline version uves/5.5.3, in 2015.
Find more information about UVES Wavelength Solution monitoring here.  
General information

Click on any of the plots to see a close-up version.

The latest date is indicated on top of the plot.

If configured,

  • data points belonging to the latest date are specially marked
  • statistical averages are indicated by a solid line, and thresholds by broken lines
  • outliers are marked by a red asterisk. They are defined as data points outside the threshold lines
  • "aliens" (= data points outside the plot Y limits) are marked by a red arrow ( or )
  • you can download the data for each parameter set if the 'Data downloads' link shows up