Plot
? |
Symb
? |
Source
* |
Average ? |
Thresholds ? |
N_
data |
QC1
parameter |
Data
downloads |
Remarks |
| method |
value |
unit |
method |
value |
| 1 |
• | QC1DB |
FIXED |
0.48 |
ADU/el |
OFF | ± 0.1 |
18 |
gain |
this |
last_yr |
all
|
GAIN, from image flats with exptime > 60 sec, readout mode 225kHz,1x1,low |
| 2 |
• | QC1DB |
FIXED |
0.558 |
ADU/el |
OFF | ± 0.1 |
15 |
gain |
this |
last_yr |
all
|
same for REDL CCD |
| 3 |
• | QC1DB |
FIXED |
0.54 |
ADU/el |
OFF | ± 0.1 |
15 |
gain |
this |
last_yr |
all
|
same for REDU CCD |
| 4 |
• | QC1DB |
FIXED |
1.69 |
ADU/el |
OFF | ± 0.1 |
18 |
gain |
this |
last_yr |
all
|
same for readout mode 50kHz,2x2,high |
| 5 |
• | QC1DB |
FIXED |
1.734 |
ADU/el |
OFF | ± 0.1 |
13 |
gain |
this |
last_yr |
all
|
same for REDL CCD |
| 6 |
• | QC1DB |
FIXED |
1.871 |
ADU/el |
OFF | ± 0.1 |
13 |
gain |
this |
last_yr |
all
|
same for REDU CCD |
| |
|
*Data sources: QC1DB: QC1 database; LOCAL: local text file
|
| Plot 1 | | data source: | uves_lingain
(QC1 database) |
| dataset: | gain | • |
| fixed average: | 0.48 | ADU/el |
| rel. thresholds: | 0.38...0.58 | ADU/el |
| N_data plotted: | 18 |
| [click on plot for closeup] |
| Plot 2 | | data source: | uves_lingain
(QC1 database) |
| dataset: | gain | • |
| fixed average: | 0.558 | ADU/el |
| rel. thresholds: | 0.458...0.658 | ADU/el |
| N_data plotted: | 15 |
| [click on plot for closeup] |
| Plot 3 | | data source: | uves_lingain
(QC1 database) |
| dataset: | gain | • |
| fixed average: | 0.54 | ADU/el |
| rel. thresholds: | 0.44...0.64 | ADU/el |
| N_data plotted: | 15 |
| [click on plot for closeup] |
| Plot 4 | | data source: | uves_lingain
(QC1 database) |
| dataset: | gain | • |
| fixed average: | 1.69 | ADU/el |
| rel. thresholds: | 1.59...1.79 | ADU/el |
| N_data plotted: | 18 |
| [click on plot for closeup] |
| Plot 5 | | data source: | uves_lingain
(QC1 database) |
| dataset: | gain | • |
| fixed average: | 1.734 | ADU/el |
| rel. thresholds: | 1.634...1.834 | ADU/el |
| N_data plotted: | 13 |
| [click on plot for closeup] |
| Plot 6 | | data source: | uves_lingain
(QC1 database) |
| dataset: | gain | • |
| fixed average: | 1.871 | ADU/el |
| rel. thresholds: | 1.771...1.971 | ADU/el |
| N_data plotted: | 13 |
| [click on plot for closeup] |
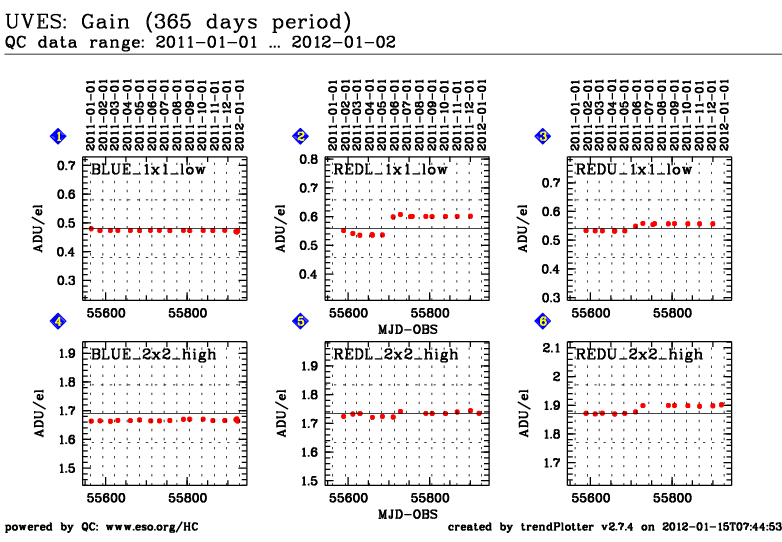
This is the trending report for UVES gain QC parameter derived from
Detector-Monitoring frames.
These frames are taken approximately once per month, as a set of 25
consecutive exposures, 5 BIAS frames and 10 pairs of FLATs of varying
exposure time and thus various signal level designed to sample the
full dynamic range of the detector.
These plots describe:
- the measured GAIN of the BLUE chip in the 1x1 binning, 225kHz, low gain readout mode
- the measured GAIN of the LOWER RED chip in the 1x1 binning, 225kHz, low gain readout mode
- the measured GAIN of the UPPER RED chip in the 1x1 binning, 225kHz, low gain readout mode
- the measured GAIN of the BLUE chip in the 2x2 binning, 50kHz, high gain readout mode
- the measured GAIN of the LOWER RED chip in the 2x2 binning, 50kHz, high gain readout mode
- the measured GAIN of the UPPER RED chip in the 2x2 binning, 50kHz, high gain readout mode
From user manuals in e-/ADU (ADU/e-):
- BLUE Chip low gain: 1.84 (0.54)
- RED CHIPL low gain: 1.5 (0.67)
- RED CHIPU low gain:1.4 (0.71)
- BLUE Chip high gain: 0.54 (1.85)
- RED CHIPL high gain: 0.52 (1.92)
- RED CHIPU high gain: 0.46 (2.17)
From KPI document:
- BLUE_1x1_225 VAL=0.461,0.483 REF=0.472
- REDL_1x1_225 VAL=0.569,0.617 REF=0.593
- REDU_1x1_225 VAL=0.543,0.567 REF=0.550
- BLUE_2x2_50 VAL=1.649,1.681 REF=1.665
- REDL_2x2_50 VAL=1.714,1.756 REF=1.735
- REDU_2x2_50 VAL=1.867,1.895 REF=1.881
Find more information about UVES DARK frames here.
Basic QC parameters related to detector properties (like median level,
ReadOut Noise, etc ) are trended
here.
General information
Click on any of the plots to see a close-up version.
The latest date is indicated on top of the plot, data points belonging to that date are specially marked.
If configured,
- statistical averages are indicated by a solid line, and thresholds by broken lines
- outliers are marked by a red asterisk. They are defined as data points outside the
threshold lines
- "aliens" (= data points outside the plot Y limits) are marked by a red arrow (↑ or ↓)
- you can download the data for each parameter set if the 'Data downloads' link shows up
|
