Plot
? |
Symb
? |
Source
* |
Average ? |
Thresholds ? |
N_
data |
QC1
parameter |
Data
downloads |
Remarks |
| method |
value |
unit |
method |
value |
| 1 |
• | QC1DB |
none |
|
ADU |
none | |
15 |
current_dark |
this |
last_yr |
all
|
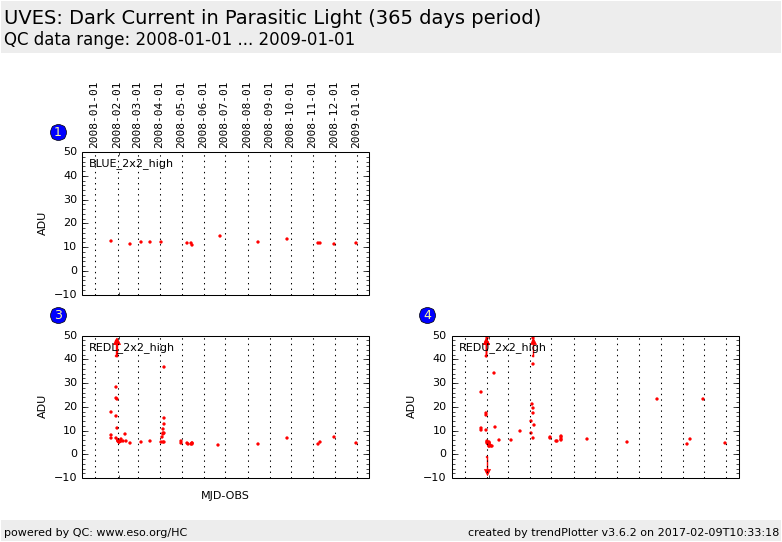
dark current in Parasitic Light, readout mode 50kHz,2x2,high; BLUE CCD |
| 3 |
• | QC1DB |
none |
|
ADU |
none | |
54 |
current_dark |
this |
last_yr |
all
|
same, for REDL CCD |
| 4 |
• | QC1DB |
none |
|
ADU |
none | |
53 |
current_dark |
this |
last_yr |
all
|
same, for REDU CCD |
| |
|
*Data sources: QC1DB: QC1 database; LOCAL: local data source
|
| Plot 1 | | data source: | uves_dark
(QC1 database) |
| dataset: | current_dark | • |
| average: | none |
| thresholds: | none |
| N_data plotted: | 15 |
| [click on plot for closeup] |
| Plot 3 | | data source: | uves_dark
(QC1 database) |
| dataset: | current_dark | • |
| average: | none |
| thresholds: | none |
| N_data plotted: | 54 |
| [click on plot for closeup] |
| Plot 4 | | data source: | uves_dark
(QC1 database) |
| dataset: | current_dark | • |
| average: | none |
| thresholds: | none |
| N_data plotted: | 53 |
| [click on plot for closeup] |
This is the trending report for UVES QC parameters derived from Parasitic
Light frames.
These frames are taken approximately once per month, as a single exposure of
3600 secs in a dark enclosure BUT with the CCD shutter OPEN (as compared to
the DARK frames where the CCD shutter is closed). These data are de-biased
and combined into a MASTER_DARK, in which the average dark level is measured
(in ADU/px/hr). [There are also shorter exposures, they are subject to false
results. If you find an outlier, check first the exposure time under 'Data
downloads'!]
The purpose of these exposures is to detect low-level contaminating light
sources (e.g. LEDs) originating INSIDE the instrument.
The thresholds are set to the values defined by the KPI document from IS
These plots describe:
- the DARK current in master PARASITIC_DARK (or PDARK) frames of the BLUE|REDL|REDU chips in the 1x1 binning, 225kHz, low gain readout mode
- same for the BLUE|REDL|REDU chips in the 2x2 binning, 50kHz, high gain readout mode.
General information
Click on any of the plots to see a close-up version.
The latest date is indicated on top of the plot.
If configured,
- data points belonging to the latest date are specially marked
- statistical averages are indicated by a solid line, and thresholds by broken lines
- outliers are marked by a red asterisk. They are defined as data points outside the
threshold lines
- "aliens" (= data points outside the plot Y limits) are marked by a red arrow (↑ or ↓)
- you can download the data for each parameter set if the 'Data downloads' link shows up
|
