SPHERE trending system: HEALTH CHECK report
Last update: 2025-12-16T05:06:49 (UT)
[enable javascript for displaying time difference!]
*Date on this monitor changes at 21:00 UT
Plot? Symb? Source Average ? Thresholds ? N_ QC1 Data Remarks
method value unit method value
1
• QC1DB MEDIAN 97.408 ADU/h VAL 70,130 14 qc_median_iframe
this |
last_yr |
all
median dark current based on 100 sec exposure, imaging channel (imaging rows)
2
• QC1DB MEDIAN 27.4751 ADU/h VAL 5,50 14 qc_median_pframe
this |
last_yr |
all
median dark current based on 100 sec exposure, unused polarimetry channel (unused rows)
3
• QC1DB MEDIAN 70.5184 ADU/h VAL 40,100 14 qc_median_iframe
this |
last_yr |
all
median dark current based on 100 sec exposure, imaging channel (imaging rows)
4
• QC1DB MEDIAN 24.1998 ADU/h VAL 5,40 14 qc_median_pframe
this |
last_yr |
all
median dark current based on 100 sec exposure, unused polarimetry channel (unused rows)
5
• QC1DB MEDIAN 2.59061 ADU none 14 qc_rms_iframe
this |
last_yr |
all
imaging channel
6
• QC1DB MEDIAN 2.5699 ADU none 14 qc_rms_pframe
this |
last_yr |
all
unused polarimetry channel
7
• QC1DB MEDIAN 2.64461 ADU none 14 qc_rms_iframe
this |
last_yr |
all
imaging channel
8
• QC1DB MEDIAN 2.69333 ADU none 14 qc_rms_pframe
this |
last_yr |
all
unused polarimetry channel
*Data sources: QC1DB: QC1 database; LOCAL: local data source
Plot 1 scores: 2 |
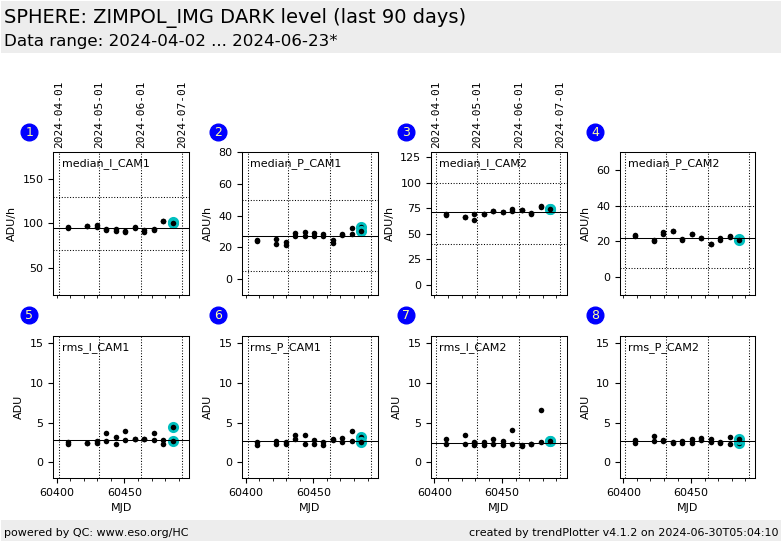
data source: sphere_zimpol_dark_img dataset: qc_median_iframe • median: 97.408 ADU/h fixed thresholds: 70...130 ADU/h N_data plotted: 14 [click plot for closeup]
Plot 2 scores: 2 |
data source: sphere_zimpol_dark_img dataset: qc_median_pframe • median: 27.4751 ADU/h fixed thresholds: 5...50 ADU/h N_data plotted: 14 [click plot for closeup]
Plot 3 scores: 2 |
data source: sphere_zimpol_dark_img dataset: qc_median_iframe • median: 70.5184 ADU/h fixed thresholds: 40...100 ADU/h N_data plotted: 14 [click plot for closeup]
Plot 4 scores: 2 |
data source: sphere_zimpol_dark_img dataset: qc_median_pframe • median: 24.1998 ADU/h fixed thresholds: 5...40 ADU/h N_data plotted: 14 [click plot for closeup]
Plot 5 scores: not implemented
data source: sphere_zimpol_dark_img dataset: qc_rms_iframe • median: 2.59061 ADU thresholds: none N_data plotted: 14 [click plot for closeup]
Plot 6 scores: not implemented
data source: sphere_zimpol_dark_img dataset: qc_rms_pframe • median: 2.5699 ADU thresholds: none N_data plotted: 14 [click plot for closeup]
Plot 7 scores: not implemented
data source: sphere_zimpol_dark_img dataset: qc_rms_iframe • median: 2.64461 ADU thresholds: none N_data plotted: 14 [click plot for closeup]
Plot 8 scores: not implemented
data source: sphere_zimpol_dark_img dataset: qc_rms_pframe • median: 2.69333 ADU thresholds: none N_data plotted: 14 [click plot for closeup]
This plot
This plot shows the optical CCD dark current values and RMS as derived from the
zimpol dark recipe for read mode StandardImaging. The recipe expresses dark values in units of the
used EXPTIME (here per 100 sec), the values in the plot are scaled to ADU/hour.
General information
Click on any of the plots to see a close-up version .
The latest date is indicated on top of the plot.
If configured,
data points belonging to the latest date are specially marked statistical averages are indicated by a solid line, and thresholds by broken lines outliers are marked by a red asterisk. They are defined as data points outside the
threshold lines "aliens" (= data points outside the plot Y limits) are marked by a red arrow (↑ ↓ you can download the data for each parameter set if the 'Data downloads' link shows up
