[page auto-refreshes after 300 sec]   [stop | on]            [press Ctrl+Shift+R to enforce refresh of scores, dates and news]
SPHERE trending system: FULL report
HELP USERS-GUIDE MORE
Last update: 2024-08-11T06:01:59 (UT)
  | now: 2024-08-17T04:17:40 (UT) muc03 QC pipeline: spher-0.52.0 (installed 2024-03-22)
close window history: 2015 2016 2017 2018 2019 2020 2021 2022 2023   2024   HEALTH FULL
  ... ... ... ... ... ... ... ...
*Date on this monitor changes at 21:00 UT
png: Information and research:
- png file - advanced studies: QC1 browser | QC1 plotter
Plot
?
Symb
?
Source
*
Average ? Thresholds ? N_
data
QC1
parameter
Data
downloads
Remarks
method value unit method value
1 QC1DB none   ADU none  606 qc_plane_rms all (full time range) readmode = SlowPolarimetry, CAM=1
2 QC1DB none   ADU none  605 qc_plane_rms all (full time range) readmode = SlowPolarimetry, CAM=2
3 QC1DB none   ADU none  1128 qc_plane_rms all (full time range) readmode = FastPolarimetry, CAM=1
4 QC1DB none   ADU none  1128 qc_plane_rms all (full time range) readmode = FastPolarimetry, CAM=2
*Data sources: QC1DB: QC1 database; LOCAL: local data source
Plot 1
scores: not implemented
data source:sphere_zimpol_modem_eff
(QC1 database)
dataset:qc_plane_rms
average:none
thresholds:none
N_data plotted:606
[click plot for closeup]
Plot 2
scores: not implemented
data source:sphere_zimpol_modem_eff
(QC1 database)
dataset:qc_plane_rms
average:none
thresholds:none
N_data plotted:605
[click plot for closeup]
Plot 3
scores: not implemented
data source:sphere_zimpol_modem_eff
(QC1 database)
dataset:qc_plane_rms
average:none
thresholds:none
N_data plotted:1128
[click plot for closeup]
Plot 4
scores: not implemented
data source:sphere_zimpol_modem_eff
(QC1 database)
dataset:qc_plane_rms
average:none
thresholds:none
N_data plotted:1128
[click plot for closeup]
This plot

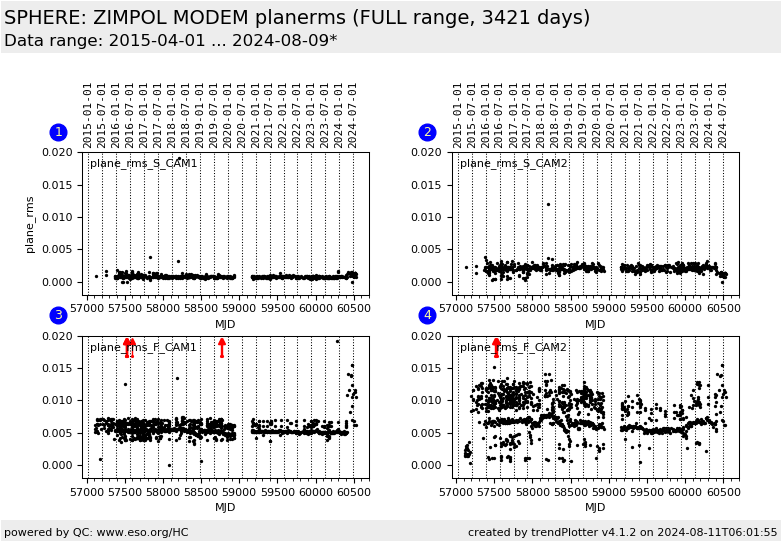
This plot monitors the instrumental issue: ZIMPOL shutter. This plot shows a QC parameter which measures if all planes of the raw frame data cube are illuminated (low rms over the plane medians) or not (high rms over the plane medians). The issue is monitored for FastPolarimetry and SlowPolarimetry readmode and for both camera, which should react syncroneously. The issue started on 2016-05-01 and was fixed on 2016-06-01. More details on the issue can be found on the SPHERE problems page (see navigation bar) or on the plot tutorial page.  


General information

Click on any of the plots to see a close-up version.

The latest date is indicated on top of the plot.

If configured,

  • data points belonging to the latest date are specially marked
  • statistical averages are indicated by a solid line, and thresholds by broken lines
  • outliers are marked by a red asterisk. They are defined as data points outside the threshold lines
  • "aliens" (= data points outside the plot Y limits) are marked by a red arrow ( or )
  • you can download the data for each parameter set if the 'Data downloads' link shows up