Plot
? |
Symb
? |
Source
* |
Average ? |
Thresholds ? |
N_
data |
QC1
parameter |
Data
downloads |
Remarks |
| method |
value |
unit |
method |
value |
| 1 |
• | QC1DB |
none |
|
ADU |
none | |
958 |
qc_med |
all (full time range)
| DIT=2, NDIT=40, Nondest |
| 2 |
• | QC1DB |
none |
|
ADU |
none | |
956 |
qc_med |
all (full time range)
| DIT=8, NDIT=25, Nondest |
| 3 |
• | QC1DB |
none |
|
ADU |
none | |
955 |
qc_med |
all (full time range)
| DIT=30, NDIT=15, Nondest |
| 4 |
• | QC1DB |
none |
|
degree |
none | |
36568 |
dettemp |
all (full time range)
| IRDIS detector temperature, INS1.TEMP101.VAL |
| |
|
*Data sources: QC1DB: QC1 database; LOCAL: local data source
|
Plot 1
scores: not implemented
| | data source: | sphere_irdis_dark
(QC1 database) |
| dataset: | qc_med | • |
| average: | none |
| thresholds: | none |
| N_data plotted: | 958 |
| [click plot for closeup] |
Plot 2
scores: not implemented
| | data source: | sphere_irdis_dark
(QC1 database) |
| dataset: | qc_med | • |
| average: | none |
| thresholds: | none |
| N_data plotted: | 956 |
| [click plot for closeup] |
Plot 3
scores: not implemented
| | data source: | sphere_irdis_dark
(QC1 database) |
| dataset: | qc_med | • |
| average: | none |
| thresholds: | none |
| N_data plotted: | 955 |
| [click plot for closeup] |
Plot 4
scores: not implemented
| | data source: | sphere_irdis_dark
(QC1 database) |
| dataset: | dettemp | • |
| average: | none |
| thresholds: | none |
| N_data plotted: | 36568 |
| [click plot for closeup] |
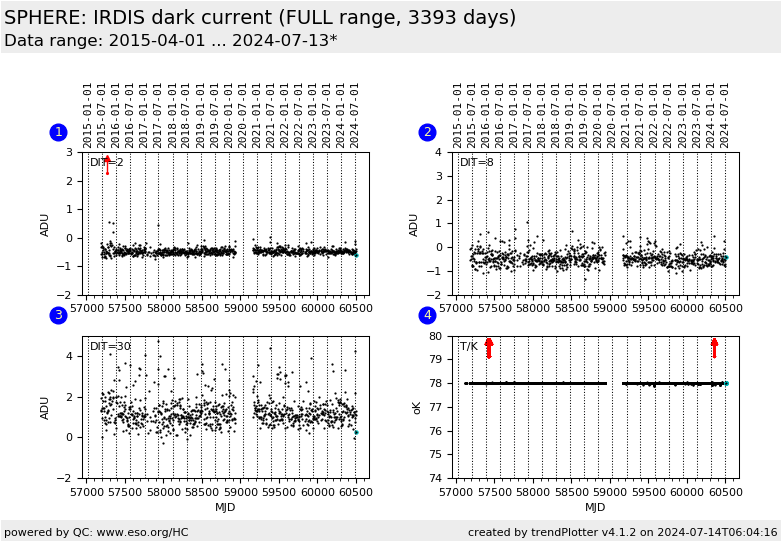
This plot shows the IRDIS detector dark level values of the three regularly acquired health check
setups
- DIT=2, NDIT=40
- DIT=8, NDIT=25
- DIT=30, NDIT=15
Darks are used as a technical monitoring of the detector but are not used to calibrate science data.
The background frames are used to calibrate science frames from four IRDIS modes CI, DBI, DPI and LSS.
General information
Click on any of the plots to see a close-up version.
The latest date is indicated on top of the plot.
If configured,
- data points belonging to the latest date are specially marked
- statistical averages are indicated by a solid line, and thresholds by broken lines
- outliers are marked by a red asterisk. They are defined as data points outside the
threshold lines
- "aliens" (= data points outside the plot Y limits) are marked by a red arrow (↑ or ↓)
- you can download the data for each parameter set if the 'Data downloads' link shows up
|
