[page auto-refreshes after 300 sec]   [stop | on]            [press Ctrl+Shift+R to enforce refresh of scores, dates and news]
SPHERE trending system: FULL report
HELP USERS-GUIDE MORE
Last update: 2024-08-11T05:46:35 (UT)
  | now: 2024-08-17T10:18:05 (UT) muc03 QC pipeline: spher-0.52.0 (installed 2024-03-22)
close window history: 2015 2016 2017 2018 2019 2020 2021 2022 2023   2024   HEALTH FULL
  ... ... ... ... ... ... ... ...
*Date on this monitor changes at 21:00 UT
png: Information and research:
- png file - advanced studies: QC1 browser | QC1 plotter
Plot
?
Symb
?
Source
*
Average ? Thresholds ? N_
data
QC1
parameter
Data
downloads
Remarks
method value unit method value
1 QC1DB none   number none  1819 qc_number_spectra all (full time range) number of spectra
2 QC1DB none   fractional none  1726 qc_scale_measured all (full time range) scale
3 QC1DB none   pixel none  1753 qc_offset_x all (full time range) x-offset in pixel as function of optical bench temperature
3 QC1DB none   pixel none  1753 qc_offset_y all (full time range) y-offset in pixel as function of optical bench temperature
4 QC1DB none   pixel none  1819 qc_offset_x all (full time range) x-offset in pixel
5 QC1DB none   pixel none  1819 qc_offset_y all (full time range) y-offset in pixel
6 QC1DB none   pixel none  1819 qc_offset_y all (full time range) x_offset versus y-offset in pixel
*Data sources: QC1DB: QC1 database; LOCAL: local data source
Plot 1
scores: not implemented
data source:sphere_ifs_specpos
(QC1 database)
dataset:qc_number_spectra
average:none
thresholds:none
N_data plotted:1819
[click plot for closeup]
Plot 2
scores: not implemented
data source:sphere_ifs_specpos
(QC1 database)
dataset:qc_scale_measured
average:none
thresholds:none
N_data plotted:1726
[click plot for closeup]
Plot 3
scores: not implemented
data source:sphere_ifs_specpos
(QC1 database)
dataset:
(numbers below apply to this dataset)
qc_offset_x
average:none
thresholds:none
N_data plotted:1753
[click plot for closeup]
Plot 4
scores: not implemented
data source:sphere_ifs_specpos
(QC1 database)
dataset:qc_offset_x
average:none
thresholds:none
N_data plotted:1819
[click plot for closeup]
Plot 5
scores: not implemented
data source:sphere_ifs_specpos
(QC1 database)
dataset:qc_offset_y
average:none
thresholds:none
N_data plotted:1819
[click plot for closeup]
Plot 6
scores: not implemented
data source:sphere_ifs_specpos
(QC1 database)
dataset:qc_offset_y
average:none
thresholds:none
N_data plotted:1819
[click plot for closeup]
This plot

This plots shows:

  • (1) The number of found slitlet spectra
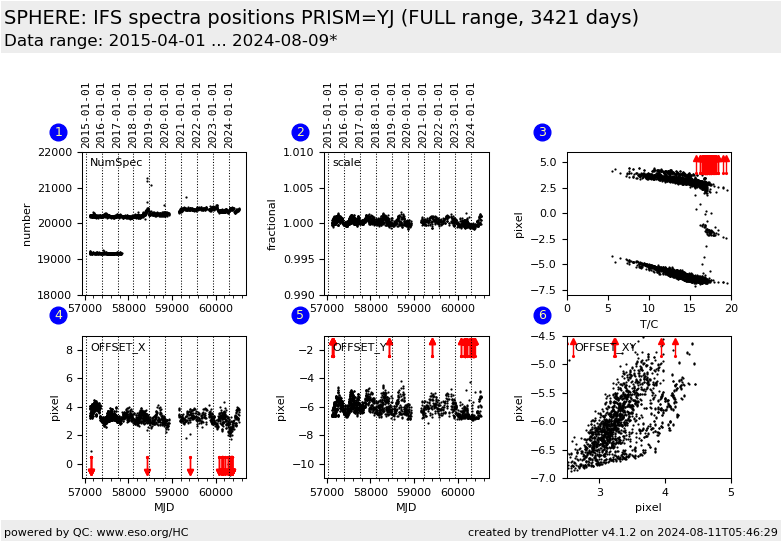
  • (2) correcting scale to fit the lenslet model and the SPOS calibration slitlet center point pattern.
  • (4,5) The pixel offset between the SPHERE IFS spectra positions of the raw input frame and the lenselet model.
  • (6) The pixel offsets in the XY-plane
  • (3) The pixel offsets as a function of the optical bench temperature. The solid lines are empirical non-linear relations. The dashed line is the empirical relation before the earth quake in 2015-11 and shows the shift by 0.6 pixel introduced by this event.
 
General information

Click on any of the plots to see a close-up version.

The latest date is indicated on top of the plot.

If configured,

  • data points belonging to the latest date are specially marked
  • statistical averages are indicated by a solid line, and thresholds by broken lines
  • outliers are marked by a red asterisk. They are defined as data points outside the threshold lines
  • "aliens" (= data points outside the plot Y limits) are marked by a red arrow ( or )
  • you can download the data for each parameter set if the 'Data downloads' link shows up