Plot
? |
Symb
? |
Source
* |
Average ? |
Thresholds ? |
N_
data |
QC1
parameter |
Data
downloads |
Remarks |
| method |
value |
unit |
method |
value |
| 1 |
• | QC1DB |
none |
|
ADU/min/deg |
none | |
502 |
qc_PersdDeg |
all (full time range)
| DIT=1.6507, NDIT=20, DIC_H, OPEN |
| 1 |
• | QC1DB |
none |
|
ADU/min/deg |
none | |
400 |
qc_PersdDeg |
all (full time range)
| DIT=1.6507, NDIT=20, DIC_K, OPEN |
| 1 |
• | QC1DB |
none |
|
ADU/min/deg |
none | |
291 |
qc_PersdDeg |
all (full time range)
| DIT=1.6507, NDIT=20, DIC_H, ND_2.0 |
| 1 |
• | QC1DB |
none |
|
ADU/min/deg |
none | |
159 |
qc_PersdDeg |
all (full time range)
| DIT=1.6507, NDIT=20, DIC_K, ND_2.0 |
| 2 |
• | QC1DB |
none |
|
ADU/min/deg |
none | |
331 |
qc_PersdDeg |
all (full time range)
| DIT=2, NDIT=20, DIC_H, OPEN |
| 2 |
• | QC1DB |
none |
|
ADU/min/deg |
none | |
256 |
qc_PersdDeg |
all (full time range)
| DIT=2, NDIT=20, DIC_K, OPEN |
| 2 |
• | QC1DB |
none |
|
ADU/min/deg |
none | |
85 |
qc_PersdDeg |
all (full time range)
| DIT=2, NDIT=20, DIC_H, ND_2.0 |
| 2 |
• | QC1DB |
none |
|
ADU/min/deg |
none | |
110 |
qc_PersdDeg |
all (full time range)
| DIT=2, NDIT=20, DIC_K, ND_2.0 |
| 3 |
• | QC1DB |
none |
|
ADU/min/deg |
none | |
365 |
qc_PersdDeg |
all (full time range)
| DIT=4, NDIT=20, DIC_H, OPEN |
| 3 |
• | QC1DB |
none |
|
ADU/min/deg |
none | |
302 |
qc_PersdDeg |
all (full time range)
| DIT=4, NDIT=20, DIC_K, OPEN |
| 3 |
• | QC1DB |
none |
|
ADU/min/deg |
none | |
163 |
qc_PersdDeg |
all (full time range)
| DIT=4, NDIT=20, DIC_H, ND_2.0 |
| 3 |
• | QC1DB |
none |
|
ADU/min/deg |
none | |
155 |
qc_PersdDeg |
all (full time range)
| DIT=4, NDIT=20, DIC_K, ND_2.0 |
| 4 |
• | QC1DB |
none |
|
ADU/min/deg |
none | |
305 |
qc_PersdDeg |
all (full time range)
| DIT=8, NDIT=15, DIC_H, OPEN |
| 4 |
• | QC1DB |
none |
|
ADU/min/deg |
none | |
308 |
qc_PersdDeg |
all (full time range)
| DIT=8, NDIT=15, DIC_K, OPEN |
| 4 |
• | QC1DB |
none |
|
ADU/min/deg |
none | |
0 |
qc_PersdDeg |
all (full time range)
| DIT=8, NDIT=15, DIC_H, ND_2.0 |
| 4 |
• | QC1DB |
none |
|
ADU/min/deg |
none | |
0 |
qc_PersdDeg |
all (full time range)
| DIT=8, NDIT=15, DIC_K, ND_2.0 |
| 5 |
• | QC1DB |
none |
|
ADU/min/deg |
none | |
382 |
qc_PersdDeg |
all (full time range)
| DIT=16, NDIT=20, DIC_H, OPEN |
| 5 |
• | QC1DB |
none |
|
ADU/min/deg |
none | |
229 |
qc_PersdDeg |
all (full time range)
| DIT=16, NDIT=20, DIC_K, OPEN |
| 5 |
• | QC1DB |
none |
|
ADU/min/deg |
none | |
125 |
qc_PersdDeg |
all (full time range)
| DIT=16, NDIT=20, DIC_H, ND_2.0 |
| 5 |
• | QC1DB |
none |
|
ADU/min/deg |
none | |
77 |
qc_PersdDeg |
all (full time range)
| DIT=16, NDIT=20, DIC_K, ND_2.0 |
| 6 |
• | QC1DB |
none |
|
ADU/min/deg |
none | |
305 |
qc_PersdDeg |
all (full time range)
| DIT=30, NDIT=25, DIC_H, OPEN |
| 6 |
• | QC1DB |
none |
|
ADU/min/deg |
none | |
308 |
qc_PersdDeg |
all (full time range)
| DIT=30, NDIT=25, DIC_K, OPEN |
| 6 |
• | QC1DB |
none |
|
ADU/min/deg |
none | |
0 |
qc_PersdDeg |
all (full time range)
| DIT=30, NDIT=25, DIC_H, ND_2.0 |
| 6 |
• | QC1DB |
none |
|
ADU/min/deg |
none | |
0 |
qc_PersdDeg |
all (full time range)
| DIT=30, NDIT=25, DIC_K, ND_2.0 |
| |
|
*Data sources: QC1DB: QC1 database; LOCAL: local data source
|
Plot 1
scores: not implemented
| | data source: | sphere_ifs_background
(QC1 database) |
dataset:
(numbers below apply to this dataset) | qc_PersdDeg | • |
| average: | none |
| thresholds: | none |
| N_data plotted: | 502 |
| [click plot for closeup] |
Plot 2
scores: not implemented
| | data source: | sphere_ifs_background
(QC1 database) |
dataset:
(numbers below apply to this dataset) | qc_PersdDeg | • |
| average: | none |
| thresholds: | none |
| N_data plotted: | 331 |
| [click plot for closeup] |
Plot 3
scores: not implemented
| | data source: | sphere_ifs_background
(QC1 database) |
dataset:
(numbers below apply to this dataset) | qc_PersdDeg | • |
| average: | none |
| thresholds: | none |
| N_data plotted: | 365 |
| [click plot for closeup] |
Plot 4
scores: not implemented
| | data source: | sphere_ifs_background
(QC1 database) |
dataset:
(numbers below apply to this dataset) | qc_PersdDeg | • |
| average: | none |
| thresholds: | none |
| N_data plotted: | 305 |
| [click plot for closeup] |
Plot 5
scores: not implemented
| | data source: | sphere_ifs_background
(QC1 database) |
dataset:
(numbers below apply to this dataset) | qc_PersdDeg | • |
| average: | none |
| thresholds: | none |
| N_data plotted: | 382 |
| [click plot for closeup] |
Plot 6
scores: not implemented
| | data source: | sphere_ifs_background
(QC1 database) |
dataset:
(numbers below apply to this dataset) | qc_PersdDeg | • |
| average: | none |
| thresholds: | none |
| N_data plotted: | 305 |
| [click plot for closeup] |
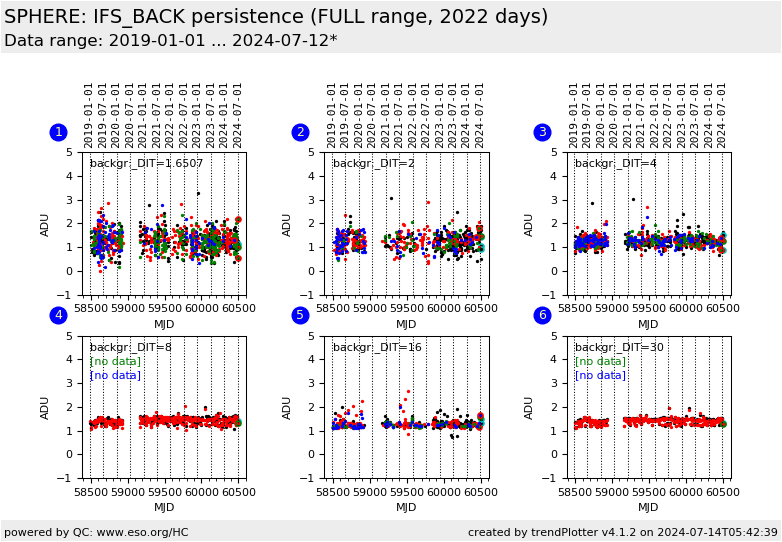
This plot monitors the persistence in IFS background calibrations
which can be generated by previously acquired IFS optical distortion calibrations.
These optical distortion calibrations can leave a pinhole slice pattern in the IFS background pipeline product.
The QC parameter is simply: the median counts in the pipeline product in a window P = [770, 130 --- 850, 1440]
minus the median counts in window B = [640, 1470 --- 720, 1570].
Window P (pinhole) is the area where the pinhole slice pattern can show up and window B (background) is the area
off the pinhole slice pattern areas on the detector.
The absolute persistence value in ADU is divided by the DIT and multiplied by 60 to represent the ADU difference for 1 min exposure time.
Because of the linear dependence to the IFS optical bench temperature relation, this value is also divided by the T_bench value, so it corresponds to 1 deg C.
This finally normalized persistence value is monitored.
General information
Click on any of the plots to see a close-up version.
The latest date is indicated on top of the plot.
If configured,
- data points belonging to the latest date are specially marked
- statistical averages are indicated by a solid line, and thresholds by broken lines
- outliers are marked by a red asterisk. They are defined as data points outside the
threshold lines
- "aliens" (= data points outside the plot Y limits) are marked by a red arrow (↑ or ↓)
- you can download the data for each parameter set if the 'Data downloads' link shows up
|
