[page auto-refreshes after 300 sec]   [stop | on]            [press Ctrl+Shift+R to enforce refresh of scores, dates and news]
SPHERE trending system: FULL report
HELP USERS-GUIDE MORE
Last update: 2024-07-17T04:57:06 (UT)
  | now: 2024-07-18T02:17:58 (UT) muc03 QC pipeline: spher-0.52.0 (installed 2024-03-22)
close window history: 2014 2015 2016 2017 2018 2019 2020 2021 2022 2023   2024   HEALTH FULL
  ... ... ... ... ... ... ... ... ...
*Date on this monitor changes at 21:00 UT
png: Information and research:
- png file - advanced studies: QC1 browser | QC1 plotter
Plot
?
Symb
?
Source
*
Average ? Thresholds ? N_
data
QC1
parameter
Data
downloads
Remarks
method value unit method value
1 QC1DB none   fractional none  1925 qc_num_badpix all (full time range) narrow band laser lamp 1 fixed pattern noise
2 QC1DB none   fractional none  1924 qc_num_badpix all (full time range) narrow band laser lamp 2 fixed pattern noise
3 QC1DB none   fractional none  1919 qc_num_badpix all (full time range) narrow band laser lamp 3 fixed pattern noise
4 QC1DB none   fractional none  1928 qc_num_badpix all (full time range) broad band halogen lamp fixed pattern noise
*Data sources: QC1DB: QC1 database; LOCAL: local data source
Plot 1
scores: not implemented
data source:sphere_ifs_dflat
(QC1 database)
dataset:qc_num_badpix
average:none
thresholds:none
N_data plotted:1925
[click plot for closeup]
Plot 2
scores: not implemented
data source:sphere_ifs_dflat
(QC1 database)
dataset:qc_num_badpix
average:none
thresholds:none
N_data plotted:1924
[click plot for closeup]
Plot 3
scores: not implemented
data source:sphere_ifs_dflat
(QC1 database)
dataset:qc_num_badpix
average:none
thresholds:none
N_data plotted:1919
[click plot for closeup]
Plot 4
scores: not implemented
data source:sphere_ifs_dflat
(QC1 database)
dataset:qc_num_badpix
average:none
thresholds:none
N_data plotted:1928
[click plot for closeup]
This plot

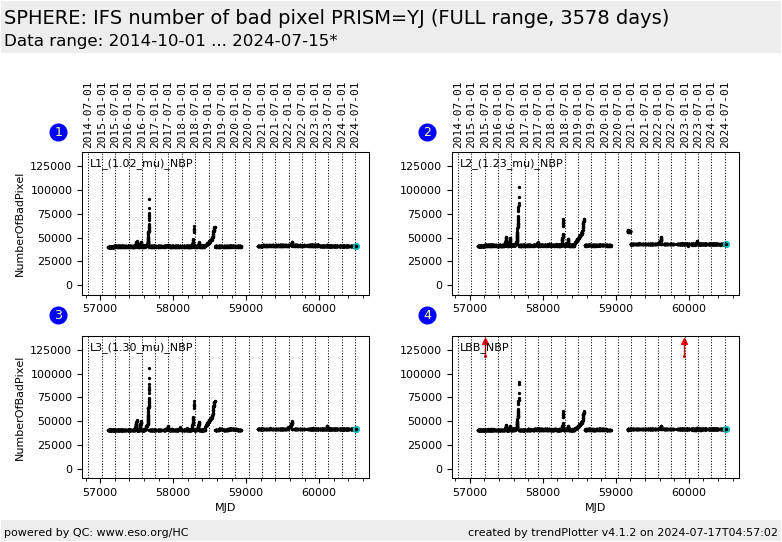
This plot shows the number of bad pixel in IFS detector flats (imaging flats), illuminated by laser lamps or by the broad band halogen lamp. The number of bad pixel is dominated (not by individual isolated pixel but) by large regions close to the edge of the detector, which are not illuminated due to the optical format.  


General information

Click on any of the plots to see a close-up version.

The latest date is indicated on top of the plot.

If configured,

  • data points belonging to the latest date are specially marked
  • statistical averages are indicated by a solid line, and thresholds by broken lines
  • outliers are marked by a red asterisk. They are defined as data points outside the threshold lines
  • "aliens" (= data points outside the plot Y limits) are marked by a red arrow ( or )
  • you can download the data for each parameter set if the 'Data downloads' link shows up