Plot
? |
Symb
? |
Source
* |
Average ? |
Thresholds ? |
N_
data |
QC1
parameter |
Data
downloads |
Remarks |
| method |
value |
unit |
method |
value |
| 1 |
• | QC1DB |
none |
|
ADU |
none | |
981 |
qc_med |
all (full time range)
| setup: DIT=2, NDIT=40, Nondest |
| 2 |
• | QC1DB |
none |
|
ADU |
none | |
980 |
qc_med |
all (full time range)
| setup: DIT=8, NDIT=25, Nondest |
| 3 |
• | QC1DB |
none |
|
ADU |
none | |
979 |
qc_med |
all (full time range)
| setup: DIT=30, NDIT=15, Nondest |
| 4 |
• | QC1DB |
none |
|
NONE |
none | |
25378 |
qc_med |
all (full time range)
| dark level as function of DIT |
| 5 |
• | QC1DB |
none |
|
NONE |
none | |
25358 |
temp_bench |
all (full time range)
| IFS optical bench temperature |
| 6 |
• | QC1DB |
none |
|
NONE |
none | |
980 |
qc_med |
all (full time range)
| setup: DIT=2, NDIT=40, Nondest |
| 6 |
• | QC1DB |
none |
|
NONE |
none | |
979 |
qc_med |
all (full time range)
| setup: DIT=8, NDIT=25, Nondest |
| 6 |
• | QC1DB |
none |
|
NONE |
none | |
978 |
qc_med |
all (full time range)
| setup: DIT=30, NDIT=15, Nondest |
| |
|
*Data sources: QC1DB: QC1 database; LOCAL: local data source
|
Plot 1
scores: not implemented
| | data source: | sphere_ifs_dark
(QC1 database) |
| dataset: | qc_med | • |
| average: | none |
| thresholds: | none |
| N_data plotted: | 981 |
| [click plot for closeup] |
Plot 2
scores: not implemented
| | data source: | sphere_ifs_dark
(QC1 database) |
| dataset: | qc_med | • |
| average: | none |
| thresholds: | none |
| N_data plotted: | 980 |
| [click plot for closeup] |
Plot 3
scores: not implemented
| | data source: | sphere_ifs_dark
(QC1 database) |
| dataset: | qc_med | • |
| average: | none |
| thresholds: | none |
| N_data plotted: | 979 |
| [click plot for closeup] |
Plot 4
scores: not implemented
| | data source: | sphere_ifs_dark
(QC1 database) |
| dataset: | qc_med | • |
| average: | none |
| thresholds: | none |
| N_data plotted: | 25378 |
| [click plot for closeup] |
Plot 5
scores: not implemented
| | data source: | sphere_ifs_dark
(QC1 database) |
| dataset: | temp_bench | • |
| average: | none |
| thresholds: | none |
| N_data plotted: | 25358 |
| [click plot for closeup] |
Plot 6
scores: not implemented
| | data source: | sphere_ifs_dark
(QC1 database) |
dataset:
(numbers below apply to this dataset) | qc_med | • |
| average: | none |
| thresholds: | none |
| N_data plotted: | 980 |
| [click plot for closeup] |
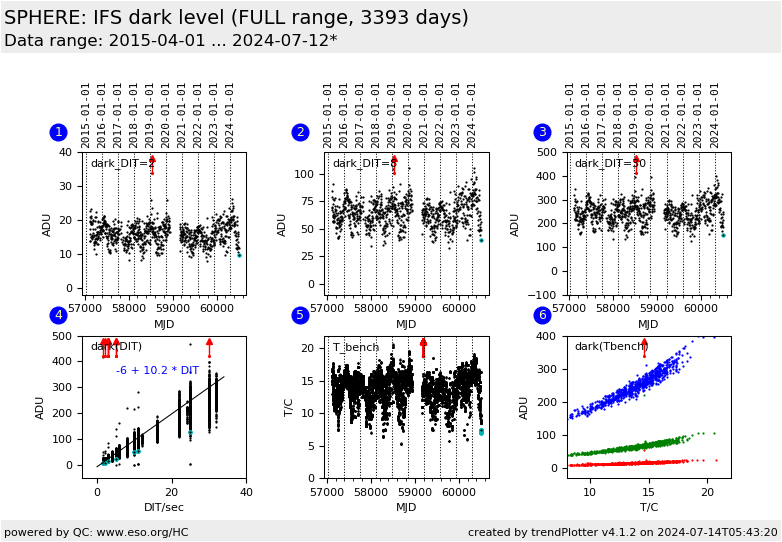
This plot monitors QC parameter darklevel of the IFS-arm
for a selected range of DIT
derived from SPHERE_irdifs_cal_dark template
and processed by the sph_isf_dark recipe.
- DIT=2, NDIT=40
- DIT=8, NDIT=25
- DIT=30, NDIT=15
Box (4) shows a linear dependence of the dark level with exposure time.
The relation is (2015-04-01)
dark [ADU] = -6 + 10.2 * DIT
Box (5) shows the IFS optical benchen temperature as function of time and
Box (6) shows the dependence of the dark level on the IFS optical bench temperature.
General information
Click on any of the plots to see a close-up version.
The latest date is indicated on top of the plot.
If configured,
- data points belonging to the latest date are specially marked
- statistical averages are indicated by a solid line, and thresholds by broken lines
- outliers are marked by a red asterisk. They are defined as data points outside the
threshold lines
- "aliens" (= data points outside the plot Y limits) are marked by a red arrow (↑ or ↓)
- you can download the data for each parameter set if the 'Data downloads' link shows up
|
