Plot
? |
Symb
? |
Source
* |
Average ? |
Thresholds ? |
N_
data |
QC1
parameter |
Data
downloads |
Remarks |
| method |
value |
unit |
method |
value |
| 1 |
• | QC1DB |
MEDIAN |
3667.75 |
ADU |
VAL | 1300,8000 |
11 |
qc_rawmed_med |
this |
last_yr |
all
|
counts in the raw frame |
| |
|
*Data sources: QC1DB: QC1 database; LOCAL: local data source
|
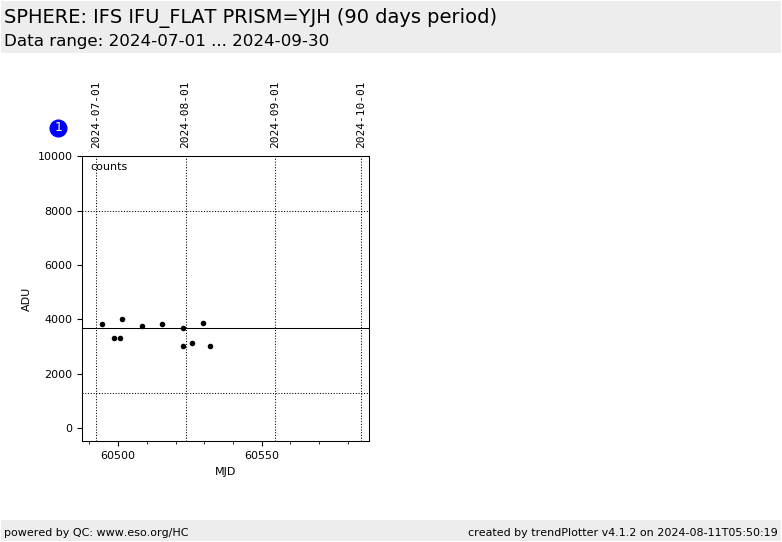
| Plot 1 | | data source: | sphere_ifs_flat
(QC1 database) |
| dataset: | qc_rawmed_med | • |
| median: | 3667.75 | ADU |
| fixed thresholds: | 1300...8000 | ADU |
| N_data plotted: | 11 |
| [click plot for closeup] |
This plot shows the median counts collected with the IFU halogen lamp within DIT=1.6507260 sec
with IFS unit and no neutral density filter in the optical path.
This plot monitors the lamp power.
(The pipeline does not provide the counts or the S/N ratio of individual slices of the master flat).
The raw frames are generated by the TPL NAME = 'Short calibration procedure for IFS' template.
For setup YJ values of about 2500 ADU are generated by the template
with TPL NAME = 'Static Weekly Flats for IFS', using DIT=2sec.
The counts in the indiviual slices is ~4 (3) times larger than the frame plane average counts for the YH (YJ) prism.
Using NDIT=10 the total counts in the slice in the raw frame cube is a factor 30 (40) larger.
Therefore 1000 (1300) ADU must be achieved as average counts number in one plane of a raw frame cube to
gain sqrt ( 1000 * 10 * 4 (3) ) = 200 S/N for the YJH (YJ) prism.
General information
Click on any of the plots to see a close-up version.
The latest date is indicated on top of the plot.
If configured,
- data points belonging to the latest date are specially marked
- statistical averages are indicated by a solid line, and thresholds by broken lines
- outliers are marked by a red asterisk. They are defined as data points outside the
threshold lines
- "aliens" (= data points outside the plot Y limits) are marked by a red arrow (↑ or ↓)
- you can download the data for each parameter set if the 'Data downloads' link shows up
|
