Plot
? |
Symb
? |
Source
* |
Average ? |
Thresholds ? |
N_
data |
QC1
parameter |
Data
downloads |
Remarks |
| method |
value |
unit |
method |
value |
| 1 |
• | QC1DB |
MEDIAN |
420.631 |
ADU/h |
VAL | 300,550 |
12 |
qc_med_zero_odd |
this |
last_yr |
all
|
median dark counts in 100 sec for phase = zero, cycle = odd |
| 2 |
• | QC1DB |
MEDIAN |
420.679 |
ADU/h |
VAL | 300,550 |
12 |
qc_med_zero_even |
this |
last_yr |
all
|
median dark counts in 100 sec for phase = zero, cycle = even |
| 3 |
• | QC1DB |
MEDIAN |
415.726 |
ADU/h |
VAL | 300,550 |
12 |
qc_med_pi_odd |
this |
last_yr |
all
|
median dark counts in 100 sec for phase = pi, cycle = odd |
| 4 |
• | QC1DB |
MEDIAN |
415.02 |
ADU/h |
VAL | 300,550 |
12 |
qc_med_pi_even |
this |
last_yr |
all
|
median dark counts in 100 sec for phase = pi, cycle = odd |
| 5 |
• | QC1DB |
MEDIAN |
10.6342 |
ADU |
none | |
12 |
qc_rms_zero_odd |
this |
last_yr |
all
|
rms for phase = zero, cycle = odd |
| 6 |
• | QC1DB |
MEDIAN |
12.8083 |
ADU |
none | |
12 |
qc_rms_zero_even |
this |
last_yr |
all
|
rms for phase = zero, cycle = even |
| 7 |
• | QC1DB |
MEDIAN |
11.369 |
ADU |
none | |
12 |
qc_rms_pi_odd |
this |
last_yr |
all
|
rms for phase = pi, cycle = odd |
| 8 |
• | QC1DB |
MEDIAN |
12.4925 |
ADU |
none | |
12 |
qc_rms_pi_even |
this |
last_yr |
all
|
rms for phase = pi, cycle = odd |
| |
|
*Data sources: QC1DB: QC1 database; LOCAL: local data source
|
| Plot 1 | | data source: | sphere_zimpol_dark_pol
(QC1 database) |
| dataset: | qc_med_zero_odd | • |
| median: | 420.631 | ADU/h |
| fixed thresholds: | 300...550 | ADU/h |
| N_data plotted: | 12 |
| [click plot for closeup] |
| Plot 2 | | data source: | sphere_zimpol_dark_pol
(QC1 database) |
| dataset: | qc_med_zero_even | • |
| median: | 420.679 | ADU/h |
| fixed thresholds: | 300...550 | ADU/h |
| N_data plotted: | 12 |
| [click plot for closeup] |
| Plot 3 | | data source: | sphere_zimpol_dark_pol
(QC1 database) |
| dataset: | qc_med_pi_odd | • |
| median: | 415.726 | ADU/h |
| fixed thresholds: | 300...550 | ADU/h |
| N_data plotted: | 12 |
| [click plot for closeup] |
| Plot 4 | | data source: | sphere_zimpol_dark_pol
(QC1 database) |
| dataset: | qc_med_pi_even | • |
| median: | 415.02 | ADU/h |
| fixed thresholds: | 300...550 | ADU/h |
| N_data plotted: | 12 |
| [click plot for closeup] |
| Plot 5 | | data source: | sphere_zimpol_dark_pol
(QC1 database) |
| dataset: | qc_rms_zero_odd | • |
| median: | 10.6342 | ADU |
| thresholds: | none | |
| N_data plotted: | 12 |
| [click plot for closeup] |
| Plot 6 | | data source: | sphere_zimpol_dark_pol
(QC1 database) |
| dataset: | qc_rms_zero_even | • |
| median: | 12.8083 | ADU |
| thresholds: | none | |
| N_data plotted: | 12 |
| [click plot for closeup] |
| Plot 7 | | data source: | sphere_zimpol_dark_pol
(QC1 database) |
| dataset: | qc_rms_pi_odd | • |
| median: | 11.369 | ADU |
| thresholds: | none | |
| N_data plotted: | 12 |
| [click plot for closeup] |
| Plot 8 | | data source: | sphere_zimpol_dark_pol
(QC1 database) |
| dataset: | qc_rms_pi_even | • |
| median: | 12.4925 | ADU |
| thresholds: | none | |
| N_data plotted: | 12 |
| [click plot for closeup] |
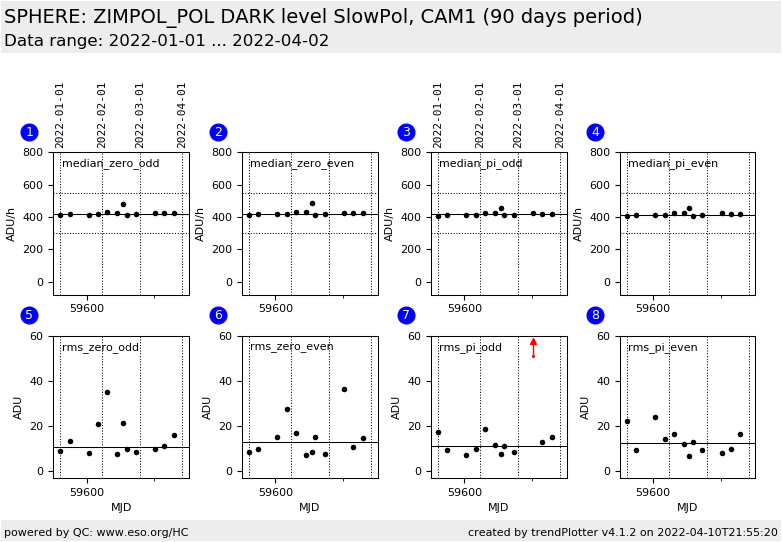
This plot shows QC parameters derived from the ZIMPOL dark recipe for both read modes SlowPolarimetry and FastPolarimetry.
odd/even means the cycle
zero/pi means the polarimetric phase
The recipe arranges the phase=pi rows and the phase=zero rows of the raw frame
and writes them in different extensions of the pipeline product.
The QC parameters describe the median and the rms of these imaging products.
The QC parameter 'median' retrieved and stored is given in ADU per 100 sec, the
values in the plots are scaled to ADU/hour.
General information
Click on any of the plots to see a close-up version.
The latest date is indicated on top of the plot.
If configured,
- data points belonging to the latest date are specially marked
- statistical averages are indicated by a solid line, and thresholds by broken lines
- outliers are marked by a red asterisk. They are defined as data points outside the
threshold lines
- "aliens" (= data points outside the plot Y limits) are marked by a red arrow (↑ or ↓)
- you can download the data for each parameter set if the 'Data downloads' link shows up
|
