Plot
? |
Symb
? |
Source
* |
Average ? |
Thresholds ? |
N_
data |
QC1
parameter |
Data
downloads |
Remarks |
| method |
value |
unit |
method |
value |
| 1 |
• | QC1DB |
none |
|
ADU |
VAL | 0,0.01 |
12 |
qc_plane_rms |
this |
last_yr |
all
|
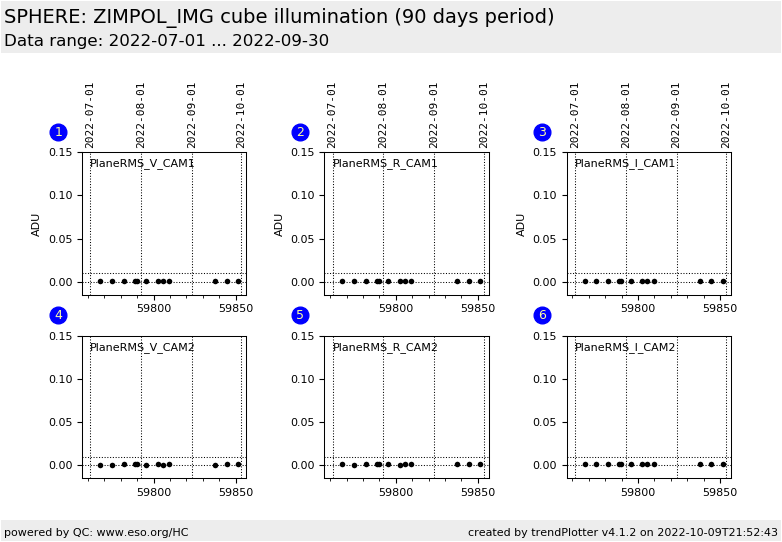
rms over planes in V imaging flats, CAM1 |
| 2 |
• | QC1DB |
none |
|
ADU |
VAL | 0,0.01 |
12 |
qc_plane_rms |
this |
last_yr |
all
|
rms over planes in R imaging flats, CAM1 |
| 3 |
• | QC1DB |
none |
|
ADU |
VAL | 0,0.01 |
12 |
qc_plane_rms |
this |
last_yr |
all
|
rms over planes in I imaging flats, CAM1 |
| 4 |
• | QC1DB |
none |
|
ADU |
VAL | 0,0.01 |
12 |
qc_plane_rms |
this |
last_yr |
all
|
rms over planes in V imaging flats, CAM2 |
| 5 |
• | QC1DB |
none |
|
ADU |
VAL | 0,0.01 |
12 |
qc_plane_rms |
this |
last_yr |
all
|
rms over planes in R imaging flats, CAM2 |
| 6 |
• | QC1DB |
none |
|
ADU |
VAL | 0,0.01 |
12 |
qc_plane_rms |
this |
last_yr |
all
|
rms over planes in I imaging flats, CAM2 |
| |
|
*Data sources: QC1DB: QC1 database; LOCAL: local data source
|
| Plot 1 | | data source: | sphere_zimpol_iflat_img
(QC1 database) |
| dataset: | qc_plane_rms | • |
| average: | none |
| fixed thresholds: | 0...0.01 | ADU |
| N_data plotted: | 12 |
| [click plot for closeup] |
| Plot 2 | | data source: | sphere_zimpol_iflat_img
(QC1 database) |
| dataset: | qc_plane_rms | • |
| average: | none |
| fixed thresholds: | 0...0.01 | ADU |
| N_data plotted: | 12 |
| [click plot for closeup] |
| Plot 3 | | data source: | sphere_zimpol_iflat_img
(QC1 database) |
| dataset: | qc_plane_rms | • |
| average: | none |
| fixed thresholds: | 0...0.01 | ADU |
| N_data plotted: | 12 |
| [click plot for closeup] |
| Plot 4 | | data source: | sphere_zimpol_iflat_img
(QC1 database) |
| dataset: | qc_plane_rms | • |
| average: | none |
| fixed thresholds: | 0...0.01 | ADU |
| N_data plotted: | 12 |
| [click plot for closeup] |
| Plot 5 | | data source: | sphere_zimpol_iflat_img
(QC1 database) |
| dataset: | qc_plane_rms | • |
| average: | none |
| fixed thresholds: | 0...0.01 | ADU |
| N_data plotted: | 12 |
| [click plot for closeup] |
| Plot 6 | | data source: | sphere_zimpol_iflat_img
(QC1 database) |
| dataset: | qc_plane_rms | • |
| average: | none |
| fixed thresholds: | 0...0.01 | ADU |
| N_data plotted: | 12 |
| [click plot for closeup] |
This plot monitors an instrumental issue:
The shutter opens after the integration sequence has already started,
leaving the first NDIT subintegrations without lamp counts.
See the 'plot tutorial' for more information on this issue.
The raw flat FITS frame is a datacube with NDIT subintegrations, each
one stored in one plane of the data cube. The RMS of the sample of NDIT
counts medians (retrieved from the NDIT planes of the data cube) is
monitored. When all subintegrations collects the same anounts of counts
the rms is low. When one or more planes collect less or no counts the
rms is high.
The following setups are monitored:
- V filter, DIT, NDIT = 4.0, 10
- N_R filter, DIT, NDIT = 2.0, 20
- N_I filter, DIT, NDIT = 2.0, 40
General information
Click on any of the plots to see a close-up version.
The latest date is indicated on top of the plot.
If configured,
- data points belonging to the latest date are specially marked
- statistical averages are indicated by a solid line, and thresholds by broken lines
- outliers are marked by a red asterisk. They are defined as data points outside the
threshold lines
- "aliens" (= data points outside the plot Y limits) are marked by a red arrow (↑ or ↓)
- you can download the data for each parameter set if the 'Data downloads' link shows up
|
