|
|
| SPHERE trending system: HISTORY report |
|
|
|
Last update: 2022-07-10T21:35:35 (UT)
|
|
|
|
|
*Date on this monitor changes at 21:00 UT |
|

|
|
|
Plot
? |
Symb
? |
Source
* |
Average ? |
Thresholds ? |
N_
data |
QC1
parameter |
Data
downloads |
Remarks |
| method |
value |
unit |
method |
value |
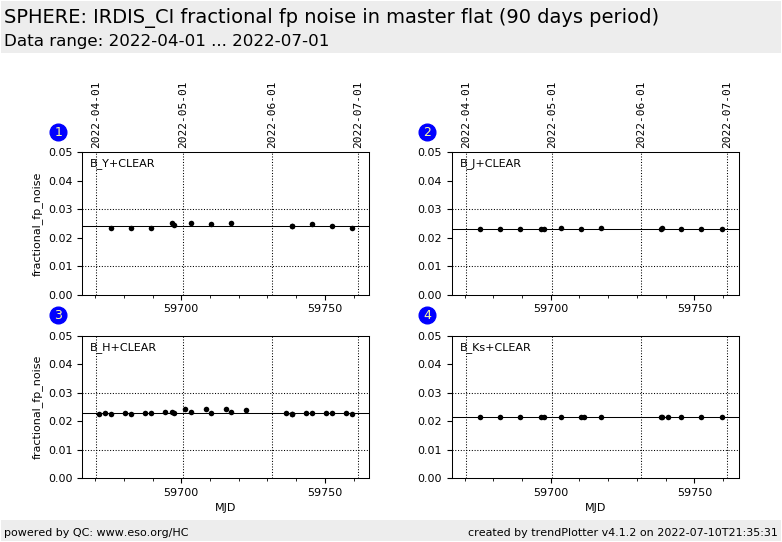
| 1 |
• | QC1DB |
MEDIAN |
0.024229 |
fractional_fp_noise |
VAL | 0.01,0.03 |
13 |
qc_fpn_left |
this |
last_yr |
all
|
Y-band left beam |
| 2 |
• | QC1DB |
MEDIAN |
0.023204 |
fractional_fp_noise |
VAL | 0.01,0.03 |
13 |
qc_fpn_left |
this |
last_yr |
all
|
J-band left beam |
| 3 |
• | QC1DB |
MEDIAN |
0.022789 |
fractional_fp_noise |
VAL | 0.01,0.03 |
26 |
qc_fpn_left |
this |
last_yr |
all
|
H-band left beam |
| 4 |
• | QC1DB |
MEDIAN |
0.02144 |
fractional_fp_noise |
VAL | 0.01,0.03 |
15 |
qc_fpn_left |
this |
last_yr |
all
|
K-band left beam |
| |
|
*Data sources: QC1DB: QC1 database; LOCAL: local data source
|
| Plot 1 | | data source: | sphere_irdis_flat
(QC1 database) |
| dataset: | qc_fpn_left | • |
| median: | 0.024229 | fractional_fp_noise |
| fixed thresholds: | 0.01...0.03 | fractional_fp_noise |
| N_data plotted: | 13 |
| [click plot for closeup] |
| Plot 2 | | data source: | sphere_irdis_flat
(QC1 database) |
| dataset: | qc_fpn_left | • |
| median: | 0.023204 | fractional_fp_noise |
| fixed thresholds: | 0.01...0.03 | fractional_fp_noise |
| N_data plotted: | 13 |
| [click plot for closeup] |
| Plot 3 | | data source: | sphere_irdis_flat
(QC1 database) |
| dataset: | qc_fpn_left | • |
| median: | 0.022789 | fractional_fp_noise |
| fixed thresholds: | 0.01...0.03 | fractional_fp_noise |
| N_data plotted: | 26 |
| [click plot for closeup] |
| Plot 4 | | data source: | sphere_irdis_flat
(QC1 database) |
| dataset: | qc_fpn_left | • |
| median: | 0.02144 | fractional_fp_noise |
| fixed thresholds: | 0.01...0.03 | fractional_fp_noise |
| N_data plotted: | 15 |
| [click plot for closeup] |
This plot shows the fractional fixed pattern noise derived from the
normalized master flat.
The QC parameter is monitored for the left beam
and for the four broad band filters in the common filter wheel: B_Y, B_H, B_J and B_K,
separately. The dual beam filter wheel is 'CLEAR' in classical imaging mode.
General information
Click on any of the plots to see a close-up version.
The latest date is indicated on top of the plot.
If configured,
- data points belonging to the latest date are specially marked
- statistical averages are indicated by a solid line, and thresholds by broken lines
- outliers are marked by a red asterisk. They are defined as data points outside the
threshold lines
- "aliens" (= data points outside the plot Y limits) are marked by a red arrow (↑ or ↓)
- you can download the data for each parameter set if the 'Data downloads' link shows up
|