Plot
? |
Symb
? |
Source
* |
Average ? |
Thresholds ? |
N_
data |
QC1
parameter |
Data
downloads |
Remarks |
| method |
value |
unit |
method |
value |
| 1 |
x | QC1DB |
MEDIAN |
39.382 |
unitless |
none | |
17 |
qc_resolv_power |
this |
last_yr |
all
|
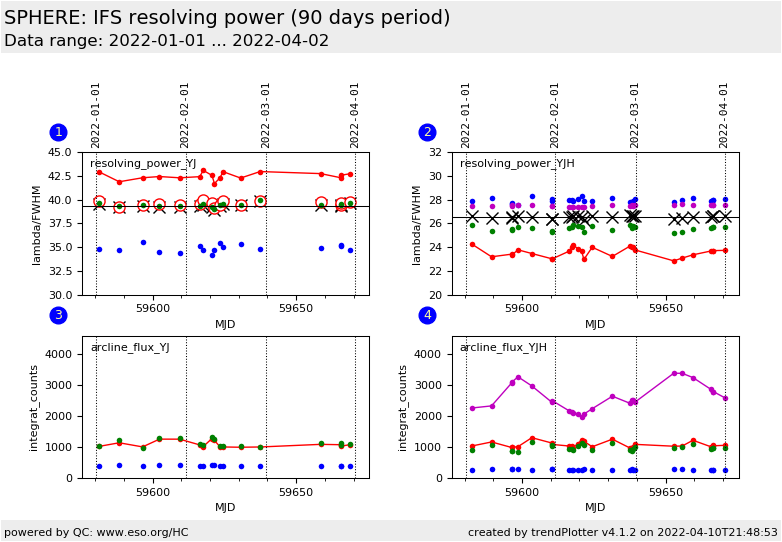
median resolving power, lambda/FWHM, YJ prism |
| 1 |
. | QC1DB |
none |
|
unitless |
none | |
17 |
respow1 |
this |
last_yr |
all
|
respow1 scaled by: 0.6 * respow1 + 14.1, to match respow2, and check if both are aligned |
| 1 |
• | QC1DB |
none |
|
NONE |
none | |
17 |
respow1 |
this |
last_yr |
all
|
resolving power in 0.9877 first (bluest) arc line |
| 1 |
• | QC1DB |
none |
|
NONE |
none | |
17 |
respow2 |
this |
last_yr |
all
|
resolving power in 1.1237 second arc line |
| 1 |
• | QC1DB |
none |
|
NONE |
none | |
17 |
respow3 |
this |
last_yr |
all
|
resolving power in 1.3094 third arc line |
| 2 |
x | QC1DB |
MEDIAN |
26.5758 |
unitless |
none | |
27 |
qc_resolv_power |
this |
last_yr |
all
|
median resolving power, lambda/FWHM, YJH prism |
| 2 |
• | QC1DB |
none |
|
NONE |
none | |
27 |
respow1 |
this |
last_yr |
all
|
resolving power in 0.9877 first (bluest) arc line |
| 2 |
• | QC1DB |
none |
|
NONE |
none | |
27 |
respow2 |
this |
last_yr |
all
|
resolving power in 1.1237 second arc line |
| 2 |
• | QC1DB |
none |
|
NONE |
none | |
27 |
respow3 |
this |
last_yr |
all
|
resolving power in 1.3094 third arc line |
| 2 |
• | QC1DB |
none |
|
NONE |
none | |
27 |
respow4 |
this |
last_yr |
all
|
resolving power in 1.5451 fourth arc line |
| 3 |
• | QC1DB |
none |
|
NONE |
none | |
17 |
flux1 |
this |
last_yr |
all
|
flux in 0.9877 first (bluest) arc line (nm * counts) |
| 3 |
• | QC1DB |
none |
|
NONE |
none | |
17 |
flux2 |
this |
last_yr |
all
|
flux in 1.1237 second arc line (nm * counts) |
| 3 |
• | QC1DB |
none |
|
NONE |
none | |
17 |
flux3 |
this |
last_yr |
all
|
flux in 1.3094 third arc line (nm * counts) |
| 4 |
• | QC1DB |
none |
|
NONE |
none | |
27 |
flux1 |
this |
last_yr |
all
|
flux in 0.9877 first (bluest) arc line (nm * counts) |
| 4 |
• | QC1DB |
none |
|
NONE |
none | |
27 |
flux2 |
this |
last_yr |
all
|
flux in 1.1237 second arc line (nm * counts) |
| 4 |
• | QC1DB |
none |
|
NONE |
none | |
27 |
flux3 |
this |
last_yr |
all
|
flux in 1.3094 third arc line (nm * counts) |
| 4 |
• | QC1DB |
none |
|
NONE |
none | |
27 |
flux4 |
this |
last_yr |
all
|
flux in 1.5451 fourth arc line (nm * counts) |
| |
|
*Data sources: QC1DB: QC1 database; LOCAL: local data source
|
