|
|
| SPHERE trending system: HISTORY report |
|
|
|
Last update: 2022-01-09T21:47:08 (UT)
|
|
|
|
|
*Date on this monitor changes at 21:00 UT |
|

|
|
|
Plot
? |
Symb
? |
Source
* |
Average ? |
Thresholds ? |
N_
data |
QC1
parameter |
Data
downloads |
Remarks |
| method |
value |
unit |
method |
value |
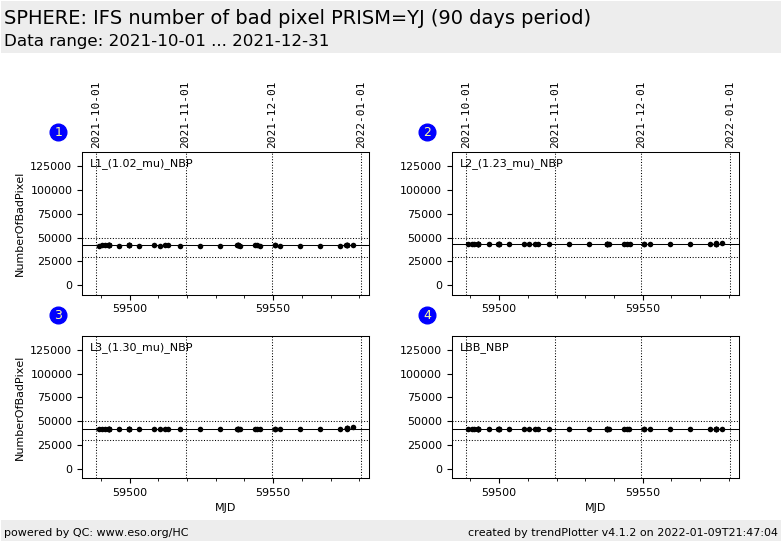
| 1 |
• | QC1DB |
MEDIAN |
41934 |
fractional |
VAL | 30000,50000 |
40 |
qc_num_badpix |
this |
last_yr |
all
|
narrow band laser lamp 1 fixed pattern noise |
| 2 |
• | QC1DB |
MEDIAN |
43449 |
fractional |
VAL | 30000,50000 |
40 |
qc_num_badpix |
this |
last_yr |
all
|
narrow band laser lamp 2 fixed pattern noise |
| 3 |
• | QC1DB |
MEDIAN |
41961 |
fractional |
VAL | 30000,50000 |
40 |
qc_num_badpix |
this |
last_yr |
all
|
narrow band laser lamp 3 fixed pattern noise |
| 4 |
• | QC1DB |
MEDIAN |
42044 |
fractional |
VAL | 30000,50000 |
40 |
qc_num_badpix |
this |
last_yr |
all
|
broad band halogen lamp fixed pattern noise |
| |
|
*Data sources: QC1DB: QC1 database; LOCAL: local data source
|
| Plot 1 | | data source: | sphere_ifs_dflat
(QC1 database) |
| dataset: | qc_num_badpix | • |
| median: | 41934 | fractional |
| fixed thresholds: | 30000...50000 | fractional |
| N_data plotted: | 40 |
| [click plot for closeup] |
| Plot 2 | | data source: | sphere_ifs_dflat
(QC1 database) |
| dataset: | qc_num_badpix | • |
| median: | 43449 | fractional |
| fixed thresholds: | 30000...50000 | fractional |
| N_data plotted: | 40 |
| [click plot for closeup] |
| Plot 3 | | data source: | sphere_ifs_dflat
(QC1 database) |
| dataset: | qc_num_badpix | • |
| median: | 41961 | fractional |
| fixed thresholds: | 30000...50000 | fractional |
| N_data plotted: | 40 |
| [click plot for closeup] |
| Plot 4 | | data source: | sphere_ifs_dflat
(QC1 database) |
| dataset: | qc_num_badpix | • |
| median: | 42044 | fractional |
| fixed thresholds: | 30000...50000 | fractional |
| N_data plotted: | 40 |
| [click plot for closeup] |
This plot shows the number of bad pixel in IFS detector flats (imaging flats),
illuminated by laser lamps or by the broad band halogen lamp.
The number of bad pixel is dominated (not by individual isolated pixel but) by
large regions close to the edge of the detector, which are not illuminated due
to the optical format.
General information
Click on any of the plots to see a close-up version.
The latest date is indicated on top of the plot.
If configured,
- data points belonging to the latest date are specially marked
- statistical averages are indicated by a solid line, and thresholds by broken lines
- outliers are marked by a red asterisk. They are defined as data points outside the
threshold lines
- "aliens" (= data points outside the plot Y limits) are marked by a red arrow (↑ or ↓)
- you can download the data for each parameter set if the 'Data downloads' link shows up
|