|
|
| SPHERE trending system: HISTORY report |
|
|
|
Last update: 2021-01-10T21:56:58 (UT)
|
|
|
|
|
*Date on this monitor changes at 21:00 UT |
|

|
|
|
Plot
? |
Symb
? |
Source
* |
Average ? |
Thresholds ? |
N_
data |
QC1
parameter |
Data
downloads |
Remarks |
| method |
value |
unit |
method |
value |
| 1 |
• | QC1DB |
MEDIAN |
1.78885 |
ADU |
VAL | 0.5,4.0 |
9 |
qc_ron |
this |
last_yr |
all
|
ron, read mode = SlowPolarimetry, camera1 |
| 2 |
• | QC1DB |
MEDIAN |
1.78885 |
ADU |
VAL | 0.5,4.0 |
9 |
qc_ron |
this |
last_yr |
all
|
ron, read mode = SlowPolarimetry, camera2 |
| 3 |
• | QC1DB |
MEDIAN |
1.73205 |
ADU |
VAL | 0.5,4.0 |
15 |
qc_ron |
this |
last_yr |
all
|
ron, read mode = FastPolarimetry, camera1 |
| 4 |
• | QC1DB |
MEDIAN |
1.67332 |
ADU |
VAL | 0.5,4.0 |
15 |
qc_ron |
this |
last_yr |
all
|
ron, read mode = FastPolarimetry, camera2 |
| |
|
*Data sources: QC1DB: QC1 database; LOCAL: local data source
|
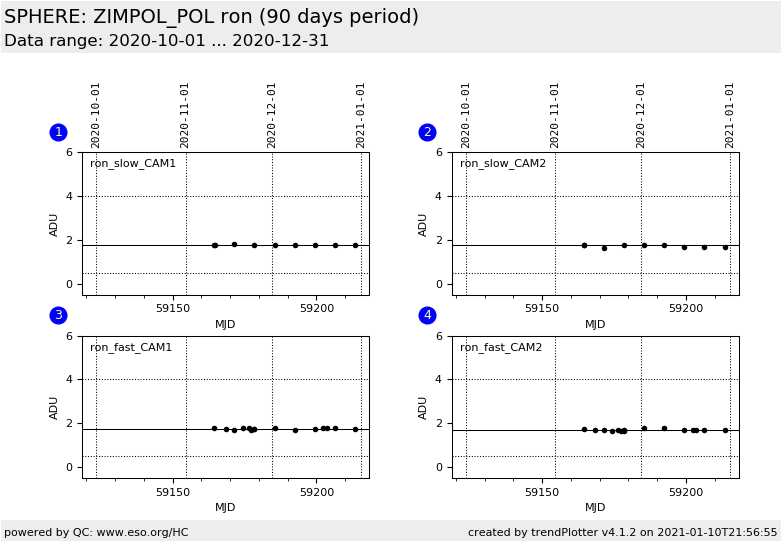
| Plot 1 | | data source: | sphere_zimpol_bias_pol
(QC1 database) |
| dataset: | qc_ron | • |
| median: | 1.78885 | ADU |
| fixed thresholds: | 0.5...4.0 | ADU |
| N_data plotted: | 9 |
| [click plot for closeup] |
| Plot 2 | | data source: | sphere_zimpol_bias_pol
(QC1 database) |
| dataset: | qc_ron | • |
| median: | 1.78885 | ADU |
| fixed thresholds: | 0.5...4.0 | ADU |
| N_data plotted: | 9 |
| [click plot for closeup] |
| Plot 3 | | data source: | sphere_zimpol_bias_pol
(QC1 database) |
| dataset: | qc_ron | • |
| median: | 1.73205 | ADU |
| fixed thresholds: | 0.5...4.0 | ADU |
| N_data plotted: | 15 |
| [click plot for closeup] |
| Plot 4 | | data source: | sphere_zimpol_bias_pol
(QC1 database) |
| dataset: | qc_ron | • |
| median: | 1.67332 | ADU |
| fixed thresholds: | 0.5...4.0 | ADU |
| N_data plotted: | 15 |
| [click plot for closeup] |
This plot shows the read out noise (RON) from SPHERE ZIMPOL BIAS raw frames
acquired in SlowPolarimetry and FastPolarimetry readmode.
The values are not retrieved from the pipeline but are calculated by using a script.
General information
Click on any of the plots to see a close-up version.
The latest date is indicated on top of the plot.
If configured,
- data points belonging to the latest date are specially marked
- statistical averages are indicated by a solid line, and thresholds by broken lines
- outliers are marked by a red asterisk. They are defined as data points outside the
threshold lines
- "aliens" (= data points outside the plot Y limits) are marked by a red arrow (↑ or ↓)
- you can download the data for each parameter set if the 'Data downloads' link shows up
|
|