Plot
? |
Symb
? |
Source
* |
Average ? |
Thresholds ? |
N_
data |
QC1
parameter |
Data
downloads |
Remarks |
| method |
value |
unit |
method |
value |
| 1 |
• | QC1DB |
none |
|
ADU/sec |
VAL | 3,16 |
11 |
qc_backrate |
this |
last_yr |
all
|
DIT=2, Nondest, INS4.OPI13.NAME=DIC_H (H-band in IRDIS) |
| 2 |
• | QC1DB |
none |
|
ADU/sec |
VAL | 3,16 |
11 |
qc_backrate |
this |
last_yr |
all
|
DIT=8, Nondest, INS4.OPI13.NAME=DIC_H (H-band in IRDIS) |
| 3 |
• | QC1DB |
none |
|
ADU/sec |
VAL | 3,16 |
11 |
qc_backrate |
this |
last_yr |
all
|
DIT=30, Nondest, INS4.OPI13.NAME=DIC_H (H-band in IRDIS) |
| 4 |
• | QC1DB |
none |
|
ADU/sec |
none | |
174 |
qc_backrate |
this |
last_yr |
all
|
|
| 4 |
• | QC1DB |
none |
|
ADU/sec |
none | |
264 |
qc_backrate |
this |
last_yr |
all
|
|
| 5 |
• | QC1DB |
none |
|
ADU/sec |
VAL | 3,16 |
12 |
qc_backrate |
this |
last_yr |
all
|
DIT=2, Nondest, INS4.OPI13.NAME=DIC_K (H-band in IFS) |
| 6 |
• | QC1DB |
none |
|
ADU/sec |
VAL | 3,16 |
12 |
qc_backrate |
this |
last_yr |
all
|
DIT=8, Nondest, INS4.OPI13.NAME=DIC_K (H-band in IFS) |
| 7 |
• | QC1DB |
none |
|
ADU/sec |
VAL | 3,16 |
12 |
qc_backrate |
this |
last_yr |
all
|
DIT=30, Nondest, INS4.OPI13.NAME=DIC_K (H-band in IFS) |
| 8 |
• | QC1DB |
none |
|
ADU/sec |
none | |
174 |
qc_median |
this |
last_yr |
all
|
DIT=any, Nondest, INS4.OPI13.NAME=DIC_H (H-band in IRDIS) |
| 8 |
• | QC1DB |
none |
|
ADU/sec |
none | |
264 |
qc_median |
this |
last_yr |
all
|
DIT=any, Nondest, INS4.OPI13.NAME=DIC_K (H-band in IFS) |
| |
|
*Data sources: QC1DB: QC1 database; LOCAL: local data source
|
| Plot 1 | | data source: | sphere_ifs_background
(QC1 database) |
| dataset: | qc_backrate | • |
| average: | none |
| fixed thresholds: | 3...16 | ADU/sec |
| N_data plotted: | 11 |
| [click plot for closeup] |
| Plot 2 | | data source: | sphere_ifs_background
(QC1 database) |
| dataset: | qc_backrate | • |
| average: | none |
| fixed thresholds: | 3...16 | ADU/sec |
| N_data plotted: | 11 |
| [click plot for closeup] |
| Plot 3 | | data source: | sphere_ifs_background
(QC1 database) |
| dataset: | qc_backrate | • |
| average: | none |
| fixed thresholds: | 3...16 | ADU/sec |
| N_data plotted: | 11 |
| [click plot for closeup] |
| Plot 4 | | data source: | sphere_ifs_background
(QC1 database) |
dataset:
(numbers below apply to this dataset) | qc_backrate | • |
| average: | none |
| thresholds: | none |
| N_data plotted: | 174 |
| [click plot for closeup] |
| Plot 5 | | data source: | sphere_ifs_background
(QC1 database) |
| dataset: | qc_backrate | • |
| average: | none |
| fixed thresholds: | 3...16 | ADU/sec |
| N_data plotted: | 12 |
| [click plot for closeup] |
| Plot 6 | | data source: | sphere_ifs_background
(QC1 database) |
| dataset: | qc_backrate | • |
| average: | none |
| fixed thresholds: | 3...16 | ADU/sec |
| N_data plotted: | 12 |
| [click plot for closeup] |
| Plot 7 | | data source: | sphere_ifs_background
(QC1 database) |
| dataset: | qc_backrate | • |
| average: | none |
| fixed thresholds: | 3...16 | ADU/sec |
| N_data plotted: | 12 |
| [click plot for closeup] |
| Plot 8 | | data source: | sphere_ifs_background
(QC1 database) |
dataset:
(numbers below apply to this dataset) | qc_median | • |
| average: | none |
| thresholds: | none |
| N_data plotted: | 174 |
| [click plot for closeup] |
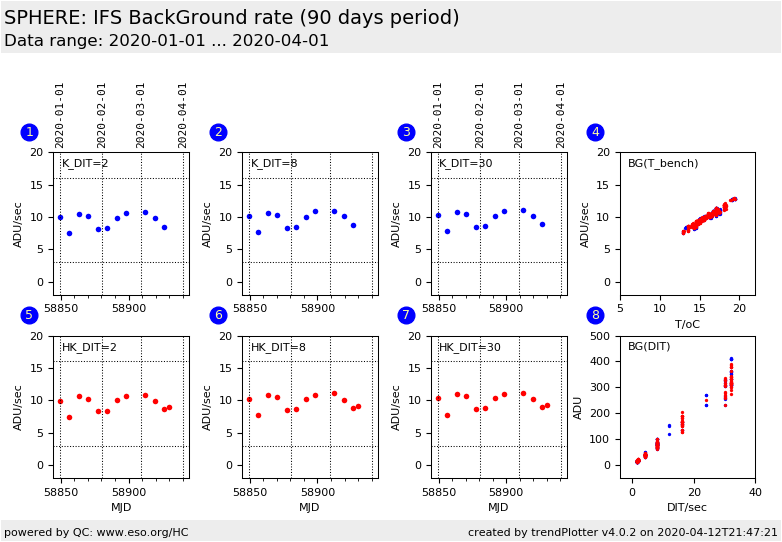
The background frames consist of the dominating detector dark current
(monitored by the IFS dark level plot) and a small component originating from the instrument.
The reported QC parameters cover
the instrumental background radiation plus the dark level of the detector.
The background has a minor dependenece on the CPI dichroic
which can be INS4.OPTI13.NAME=DIC_H or DIC_K and a major dependence on the
IFS bench temperature.
General information
Click on any of the plots to see a close-up version.
The latest date is indicated on top of the plot.
If configured,
- data points belonging to the latest date are specially marked
- statistical averages are indicated by a solid line, and thresholds by broken lines
- outliers are marked by a red asterisk. They are defined as data points outside the
threshold lines
- "aliens" (= data points outside the plot Y limits) are marked by a red arrow (↑ or ↓)
- you can download the data for each parameter set if the 'Data downloads' link shows up
|
