Plot
? |
Symb
? |
Source
* |
Average ? |
Thresholds ? |
N_
data |
QC1
parameter |
Data
downloads |
Remarks |
| method |
value |
unit |
method |
value |
| 1 |
• | QC1DB |
MEDIAN |
5.08721 |
ADU |
VAL | 1,7 |
27 |
qc_ron |
this |
last_yr |
all
|
setup: DIT=2, NDIT=40, Nondest |
| 2 |
• | QC1DB |
MEDIAN |
6.80766 |
ADU |
VAL | 4,9 |
27 |
qc_ron |
this |
last_yr |
all
|
setup: DIT=8, NDIT=25, Nondest |
| 3 |
• | QC1DB |
MEDIAN |
11.4327 |
ADU |
VAL | 5,17 |
27 |
qc_ron |
this |
last_yr |
all
|
setup: DIT=30, NDIT=15, Nondest |
| 4 |
• | QC1DB |
none |
|
NONE |
none | |
495 |
qc_ron |
this |
last_yr |
all
|
ron as function of DIT |
| 5 |
• | QC1DB |
none |
|
NONE |
none | |
495 |
temp_bench |
this |
last_yr |
all
|
IFS optical bench temperature |
| 6 |
• | QC1DB |
none |
|
NONE |
none | |
27 |
qc_ron |
this |
last_yr |
all
|
setup: DIT=2, NDIT=40, Nondest |
| 6 |
• | QC1DB |
none |
|
NONE |
none | |
27 |
qc_ron |
this |
last_yr |
all
|
setup: DIT=8, NDIT=25, Nondest |
| 6 |
• | QC1DB |
none |
|
NONE |
none | |
27 |
qc_ron |
this |
last_yr |
all
|
setup: DIT=30, NDIT=15, Nondest |
| |
|
*Data sources: QC1DB: QC1 database; LOCAL: local data source
|
| Plot 1 | | data source: | sphere_ifs_dark
(QC1 database) |
| dataset: | qc_ron | • |
| median: | 5.08721 | ADU |
| fixed thresholds: | 1...7 | ADU |
| N_data plotted: | 27 |
| [click plot for closeup] |
| Plot 2 | | data source: | sphere_ifs_dark
(QC1 database) |
| dataset: | qc_ron | • |
| median: | 6.80766 | ADU |
| fixed thresholds: | 4...9 | ADU |
| N_data plotted: | 27 |
| [click plot for closeup] |
| Plot 3 | | data source: | sphere_ifs_dark
(QC1 database) |
| dataset: | qc_ron | • |
| median: | 11.4327 | ADU |
| fixed thresholds: | 5...17 | ADU |
| N_data plotted: | 27 |
| [click plot for closeup] |
| Plot 4 | | data source: | sphere_ifs_dark
(QC1 database) |
| dataset: | qc_ron | • |
| average: | none |
| thresholds: | none |
| N_data plotted: | 495 |
| [click plot for closeup] |
| Plot 5 | | data source: | sphere_ifs_dark
(QC1 database) |
| dataset: | temp_bench | • |
| average: | none |
| thresholds: | none |
| N_data plotted: | 495 |
| [click plot for closeup] |
| Plot 6 | | data source: | sphere_ifs_dark
(QC1 database) |
dataset:
(numbers below apply to this dataset) | qc_ron | • |
| average: | none |
| thresholds: | none |
| N_data plotted: | 27 |
| [click plot for closeup] |
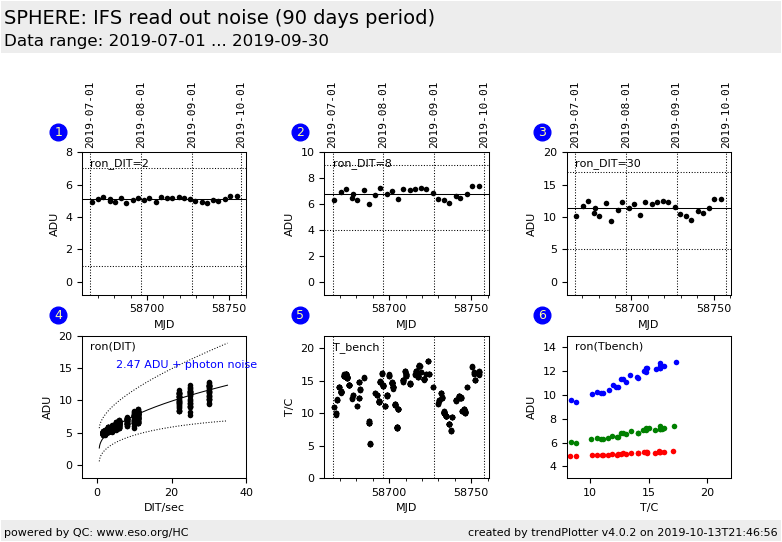
The QC parameter qc_ron is not calculated by the pipeline but by a QC script.
From the raw frame fits cube, five planes are extracted (plane 6 to 10), and
for each pixel the stdev (out of five independent reads) is calculated.
The median over all pixels stdev is taken.
The parameter qc_ron contains statistical noise, which is composed of a static detector readout
noise component of 2.47 ADU and a exposure time dependent component of
sqrt(counts / gain)
corresponding to the shot noise induced by the background radiation.
In box (4) the function 2.47 + sqrt(-6 + 10.2 * DIT / 3.6) is overplotted.
The three reference setups (DIT=2, 8, and 30) are scored according to the dashed lines in boxes
1,2, and 3. All other setups are scored according to the non-linear arithmetic relation
indicated by the dashed curves in box 4.
- upper threshold = sqrt((-6 + 10.2 * DIT)/3.6)+2.47 -2.0-0.1*DIT
- lower threshold = sqrt((-6 + 10.2 * DIT)/3.6)+2.47 +3.0+0.1*DIT
General information
Click on any of the plots to see a close-up version.
The latest date is indicated on top of the plot.
If configured,
- data points belonging to the latest date are specially marked
- statistical averages are indicated by a solid line, and thresholds by broken lines
- outliers are marked by a red asterisk. They are defined as data points outside the
threshold lines
- "aliens" (= data points outside the plot Y limits) are marked by a red arrow (↑ or ↓)
- you can download the data for each parameter set if the 'Data downloads' link shows up
|
