|
|
| SPHERE trending system: HISTORY report |
|
|
|
Last update: 2019-05-29T15:43:45 (UT)
|
|
|
|
|
*Date on this monitor changes at 21:00 UT |
|

|
|
|
Plot
? |
Symb
? |
Source
* |
Average ? |
Thresholds ? |
N_
data |
QC1
parameter |
Data
downloads |
Remarks |
| method |
value |
unit |
method |
value |
| 1 |
• | QC1DB |
MEDIAN |
991.8 |
ADU |
OFF | ± 20 |
19 |
qc_bias |
this |
last_yr |
all
|
bias level, read mode = SlowPolarimetry, camera1& |
| 2 |
• | QC1DB |
MEDIAN |
981.25 |
ADU |
OFF | ± 20 |
19 |
qc_bias |
this |
last_yr |
all
|
bias level, read mode = SlowPolarimetry, camera2 |
| 3 |
• | QC1DB |
MEDIAN |
988.1 |
ADU |
OFF | ± 20 |
21 |
qc_bias |
this |
last_yr |
all
|
bias level, read mode = FastPolarimetry, camera1 |
| 4 |
• | QC1DB |
MEDIAN |
988.6 |
ADU |
OFF | ± 20 |
21 |
qc_bias |
this |
last_yr |
all
|
bias level, read mode = FastPolarimetry, camera2 |
| |
|
*Data sources: QC1DB: QC1 database; LOCAL: local data source
|
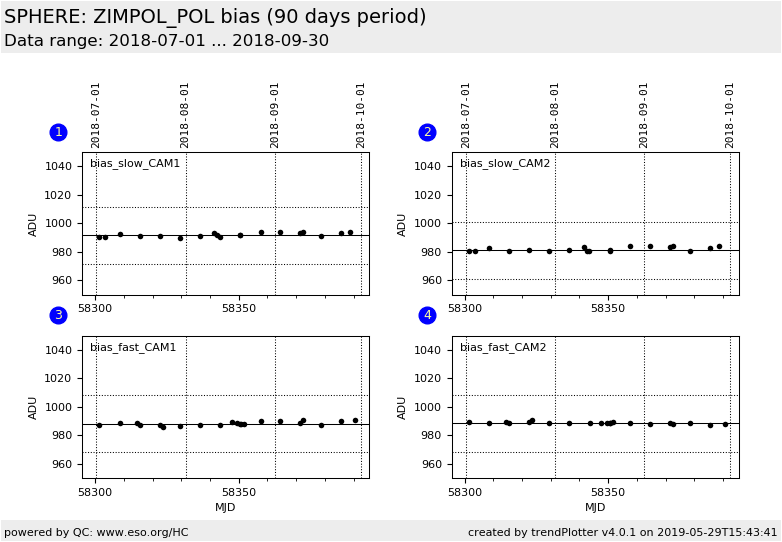
| Plot 1 | | data source: | sphere_zimpol_bias_pol
(QC1 database) |
| dataset: | qc_bias | • |
| median: | 991.8 | ADU |
| rel. thresholds: | 971.8...1011.8 | ADU |
| N_data plotted: | 19 |
| [click plot for closeup] |
| Plot 2 | | data source: | sphere_zimpol_bias_pol
(QC1 database) |
| dataset: | qc_bias | • |
| median: | 981.25 | ADU |
| rel. thresholds: | 961.25...1001.25 | ADU |
| N_data plotted: | 19 |
| [click plot for closeup] |
| Plot 3 | | data source: | sphere_zimpol_bias_pol
(QC1 database) |
| dataset: | qc_bias | • |
| median: | 988.1 | ADU |
| rel. thresholds: | 968.1...1008.1 | ADU |
| N_data plotted: | 21 |
| [click plot for closeup] |
| Plot 4 | | data source: | sphere_zimpol_bias_pol
(QC1 database) |
| dataset: | qc_bias | • |
| median: | 988.6 | ADU |
| rel. thresholds: | 968.6...1008.6 | ADU |
| N_data plotted: | 21 |
| [click plot for closeup] |
This plot shows the ZIMPOL raw frame bias level for readmode
FastPolarimetry and SlowPolarimetry and for both cameras CAM1 and CAM2. The values are retrieved by using
a script. The median of the first plane of the raw frame cube is used.
General information
Click on any of the plots to see a close-up version.
The latest date is indicated on top of the plot.
If configured,
- data points belonging to the latest date are specially marked
- statistical averages are indicated by a solid line, and thresholds by broken lines
- outliers are marked by a red asterisk. They are defined as data points outside the
threshold lines
- "aliens" (= data points outside the plot Y limits) are marked by a red arrow (↑ or ↓)
- you can download the data for each parameter set if the 'Data downloads' link shows up
|
|