|
|
| SPHERE trending system: HISTORY report |
|
|
|
Last update: 2019-05-29T14:52:19 (UT)
|
|
|
|
|
*Date on this monitor changes at 21:00 UT |
|

|
|
|
Plot
? |
Symb
? |
Source
* |
Average ? |
Thresholds ? |
N_
data |
QC1
parameter |
Data
downloads |
Remarks |
| method |
value |
unit |
method |
value |
| 1 |
• | QC1DB |
MEDIAN |
20197 |
number |
8% | ± 1615.76 |
60 |
qc_number_spectra |
this |
last_yr |
all
|
number of spectra |
| 2 |
• | QC1DB |
MEDIAN |
1.00048 |
fractional |
0.5% | ± 0.00500238 |
60 |
qc_scale_measured |
this |
last_yr |
all
|
scale |
| 3 |
• | QC1DB |
none |
|
pixel |
none | |
60 |
qc_offset_x |
this |
last_yr |
all
|
x-offset in pixel as function of optical bench temperature |
| 3 |
• | QC1DB |
none |
|
pixel |
none | |
60 |
qc_offset_y |
this |
last_yr |
all
|
y-offset in pixel as function of optical bench temperature |
| 4 |
• | QC1DB |
MEDIAN |
3.25051 |
pixel |
OFF | ± 1.5 |
60 |
qc_offset_x |
this |
last_yr |
all
|
x-offset in pixel |
| 5 |
• | QC1DB |
MEDIAN |
-5.85934 |
pixel |
OFF | ± 1.5 |
60 |
qc_offset_y |
this |
last_yr |
all
|
y-offset in pixel |
| 6 |
• | QC1DB |
none |
|
pixel |
none | |
60 |
qc_offset_y |
this |
last_yr |
all
|
x_offset versus y-offset in pixel |
| |
|
*Data sources: QC1DB: QC1 database; LOCAL: local data source
|
| Plot 1 | | data source: | sphere_ifs_specpos
(QC1 database) |
| dataset: | qc_number_spectra | • |
| median: | 20197 | number |
| rel. thresholds: ±8% | 18581.24...21812.76 | number |
| N_data plotted: | 60 |
| [click plot for closeup] |
| Plot 2 | | data source: | sphere_ifs_specpos
(QC1 database) |
| dataset: | qc_scale_measured | • |
| median: | 1.00048 | fractional |
| rel. thresholds: ±0.5% | 0.9954741175...1.0054788825 | fractional |
| N_data plotted: | 60 |
| [click plot for closeup] |
| Plot 3 | | data source: | sphere_ifs_specpos
(QC1 database) |
dataset:
(numbers below apply to this dataset) | qc_offset_x | • |
| average: | none |
| thresholds: | none |
| N_data plotted: | 60 |
| [click plot for closeup] |
| Plot 4 | | data source: | sphere_ifs_specpos
(QC1 database) |
| dataset: | qc_offset_x | • |
| median: | 3.25051 | pixel |
| rel. thresholds: | 1.750507...4.750507 | pixel |
| N_data plotted: | 60 |
| [click plot for closeup] |
| Plot 5 | | data source: | sphere_ifs_specpos
(QC1 database) |
| dataset: | qc_offset_y | • |
| median: | -5.85934 | pixel |
| rel. thresholds: | -7.3593425...-4.3593425 | pixel |
| N_data plotted: | 60 |
| [click plot for closeup] |
| Plot 6 | | data source: | sphere_ifs_specpos
(QC1 database) |
| dataset: | qc_offset_y | • |
| average: | none |
| thresholds: | none |
| N_data plotted: | 60 |
| [click plot for closeup] |
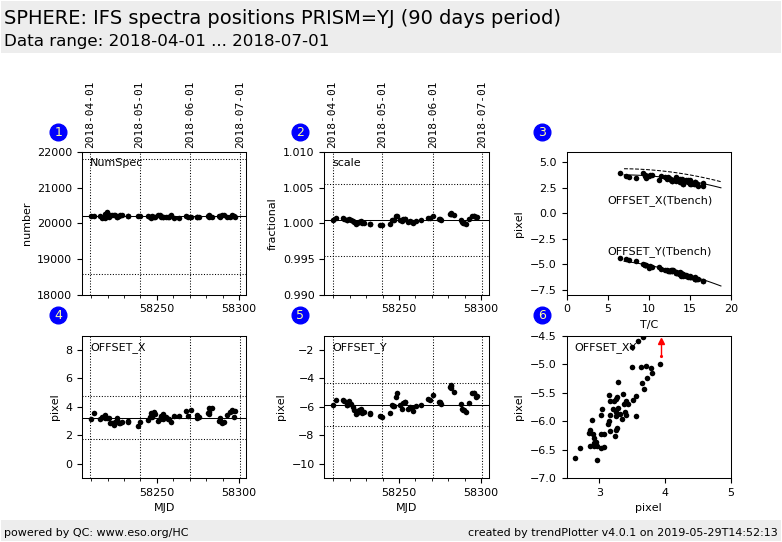
This plots shows:
- (1) The number of found slitlet spectra
- (2) correcting scale to fit the lenslet model and the SPOS calibration slitlet center point pattern.
- (4,5) The pixel offset between the SPHERE IFS spectra positions of the raw input frame and the lenselet model.
- (6) The pixel offsets in the XY-plane
- (3) The pixel offsets as a function of the optical bench temperature.
The solid lines are empirical non-linear relations.
The dashed line is the empirical relation before the earth quake in 2015-11 and
shows the shift by 0.6 pixel introduced by this event.
General information
Click on any of the plots to see a close-up version.
The latest date is indicated on top of the plot.
If configured,
- data points belonging to the latest date are specially marked
- statistical averages are indicated by a solid line, and thresholds by broken lines
- outliers are marked by a red asterisk. They are defined as data points outside the
threshold lines
- "aliens" (= data points outside the plot Y limits) are marked by a red arrow (↑ or ↓)
- you can download the data for each parameter set if the 'Data downloads' link shows up
|